Uniswap Price Prediction: UNI/USDT Market Faces Rejection
Estimated Reading Time: 3 minutes
Don’t invest unless you’re prepared to lose all the money you invest. This is a high-risk investment and you are unlikely to be protected if something goes wrong. Take 2 minutes to learn more

Uniswap Price Prediction (January 16):
The Uniswap token continues to trade above a medium-term support level of $12.74. Furthermore, price movement in the ongoing session has rebounded off a key resistance level, which may serve as an effective resistance point.
UNI/USDT Long-Term Trend: Bearish (Daily Chart)
Key Price Levels:
Resistance: $98.00, $100.00, $102.00
Support: $96.00, $94.00, $92.00
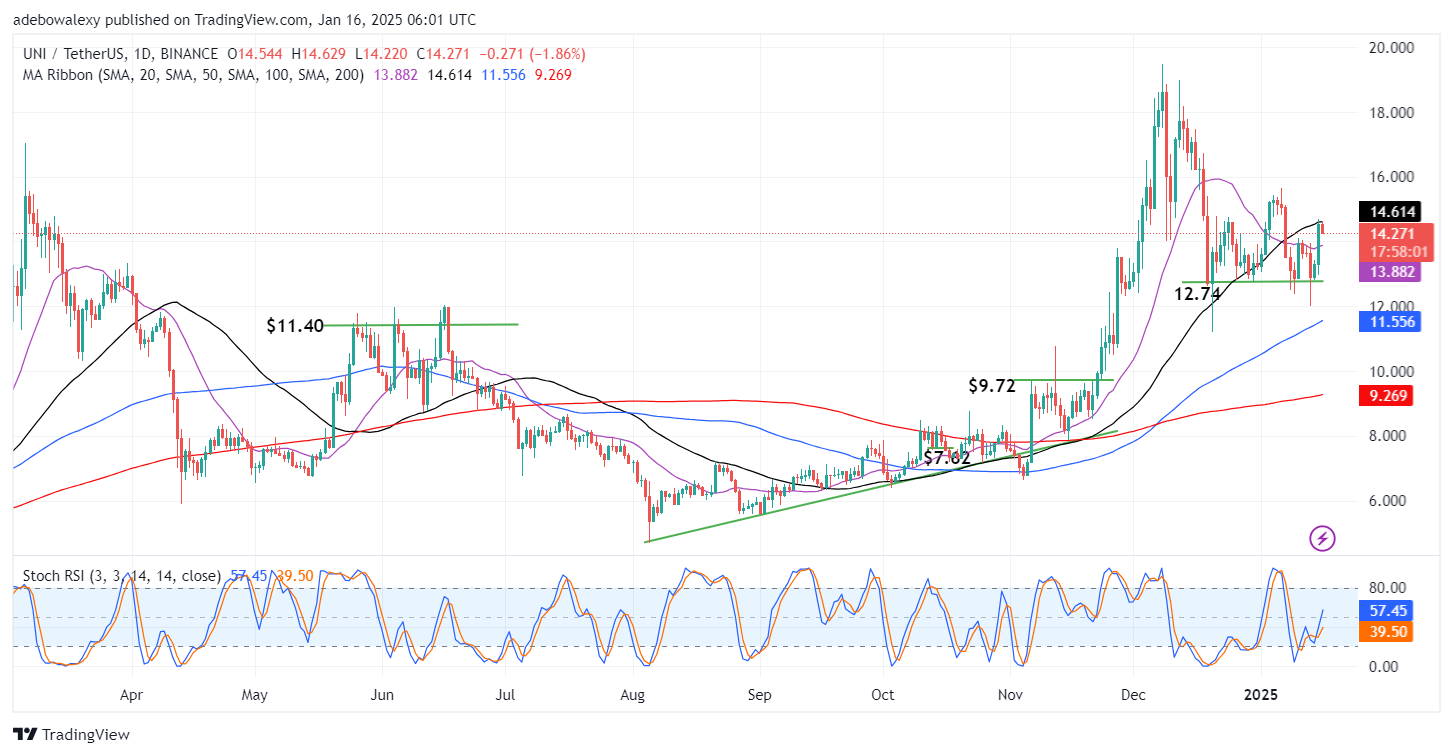
The last price candle on the Uniswap daily chart has rebounded off the 50-day Moving Average curve. Nevertheless, the gains from the previous session continue to overshadow the earlier downward rejection. Additionally, the token’s price remains above most of the Moving Average (MA) lines on the daily chart. The Stochastic Relative Strength Index (RSI) lines maintain an upward trajectory from the oversold region, signaling potential bullish momentum.
Uniswap Price Prediction: Will UNI/USDT Bulls Charge Through the $15 Mark?
Price action in the Uniswap daily market has hit resistance at the 50-day MA line. As a result, the market has rebounded downward in today’s trading session. Technically, the sudden price surge in the previous session appears to have attracted bearish attention, as price action seems to have hit short-term targets.
Nevertheless, the latest price candle keeps the token’s price above most of the MA lines. Meanwhile, the Stochastic RSI lines are not yet reflecting the recent setback, as they remain sharply upward. This suggests that price action still has the potential to move higher in subsequent sessions.
Uniswap Price Prediction: UNI/USDT Retains Favorable Support Level (4-Hour Chart)
The Uniswap market on the 4-hour chart shows some interesting trends. Price activity has risen past all the MA lines on the chart. Although the market has retraced downward, it remains above these lines. The market appears to be losing bearish momentum as it approaches the 200-day MA line, which is acting as support.
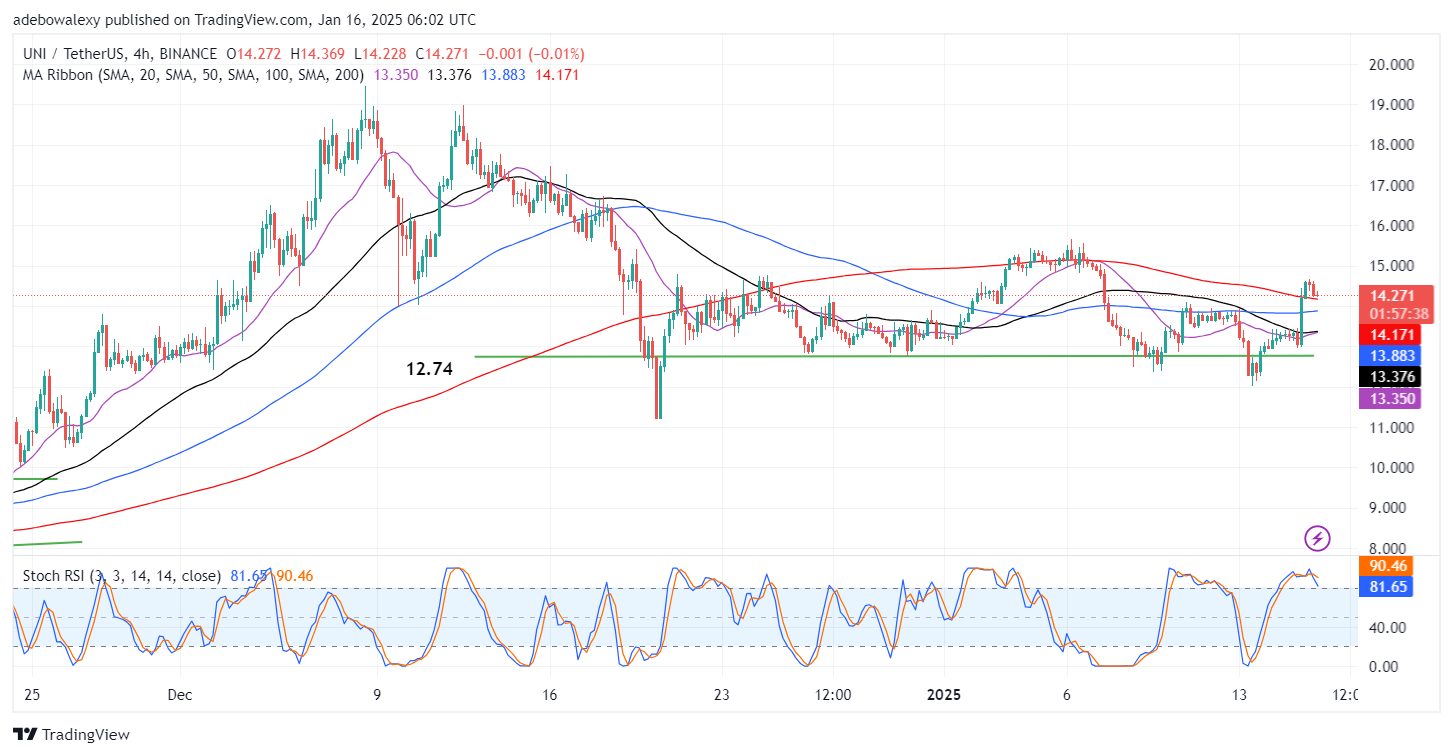
At the same time, the Stochastic RSI lines are descending toward the 80-mark. Meanwhile, a crossover between the 20- and 50-day MA lines coincides with the decline in bearish momentum, hinting at a potential upward rebound at the 200-day MA line. As a result, traders may target the $15.00 mark in upcoming sessions.