Bitcoin (BTC/USD) Retraces Downward After Hitting the Immediate Resistance Level of $65,000
Estimated Reading Time: 3 minutes
Don’t invest unless you’re prepared to lose all the money you invest. This is a high-risk investment and you are unlikely to be protected if something goes wrong. Take 2 minutes to learn more
Bitcoin Price Prediction – April 16
It now appears that the BTC/USD market valuation is currently facing a kind of price retracement move as it hit a new higher key resistance mark at $65,000 on April 14 trading day’s session.
BTC/USD Market
Key Levels:
Resistance levels: $65,500, $70,000, $75,000
Support levels: $55,000, $50,000, $45,000
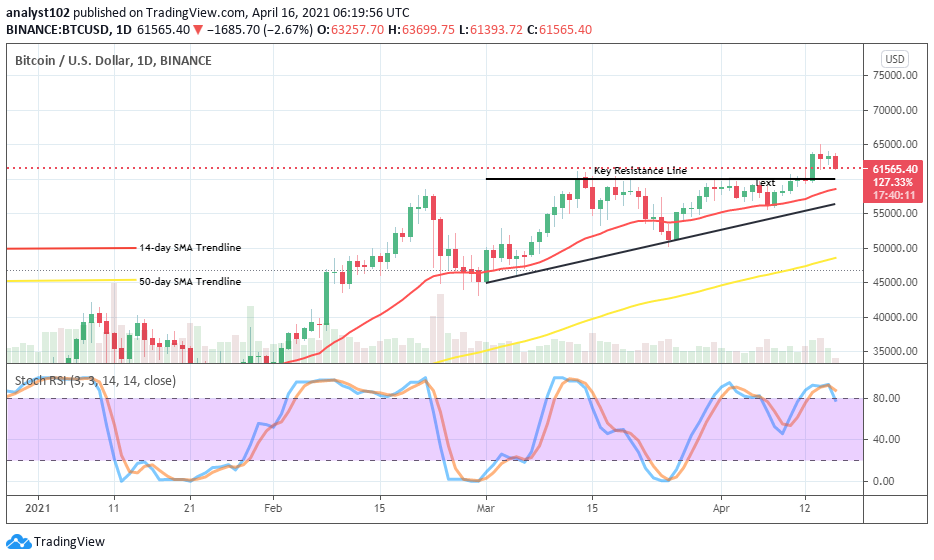
BTC/USD – Daily Chart
The recent past $60,000 key resistance line on the BTC/USD daily trading chart is still in focus as the price now tends to move towards it at a high noticeable rate after hitting the main current resistance level at $65,000. In the meantime, both the 14-day SMA trend-line and, the bullish trend-line is still drawn to give a supportive outlook to affirm that the market trades on a high zone of buy signal side. The 50-day SMA indicator is situated close to the $50,000 support line below them. The Stochastic Oscillators have crossed the hairs in the overbought region very close to range 80. That indicates a slight return of a decline in the crypto-economy that is currently going on.
Will the BTC/USD price revisits its last long-standing resistance value at $60,000?
Currently, the BTC/USD market is on a relatively slide-moving outlook. And, it is most likely seemed that price is moving in such a manner to locate for support around the former resistance level of $60,000. The critical support trading is said to be at that level of $55,000 in a worst downward-moving scenario afterward. However, a quick bearish reversal shouldn’t be overlooked while a sharp downward move is even made during volatility.
Taking a look at what the crypto-market may now be seen as the depreciation trading session, as it has been noted that price has resisted at a vital line of $65,000 level. And, that has led to a start of a small decline in the BTC/USD trade. A forceful breakdown of the last key resistance line at $60,000 is necessary to suggest the return of a bearish move in this market.
BTC/BTC Price Analysis
It is presently depicted on the BTC/USD 4-hour medium-term that price is now trading in what looks like a downward correctional moving manner. The 14-day SMA has breached southwardly. The critical support line is drawn at the $60,000 with the 50-day SMA trend-line places a supportive posture near from the below. The Stochastic Oscillators are dipped into the oversold region. They have conjoined the hairs within it to signify that bears are to some extent in control of the crypto-economy as of the time of writing. The critical support level of $60,000 will play a sound decisive role in the determination of a bearish move if price eventually revisits for touches it.
Note: cryptosignals.org is not a financial advisor. Do your research before investing your funds in any financial asset or presented product or event. We are not responsible for your investing results.