Helium (HNT/USD) Stages Significant Rebound — Is the Bearish Trend Nearing Its End?
Estimated Reading Time: 4 minutes
Don’t invest unless you’re prepared to lose all the money you invest. This is a high-risk investment and you are unlikely to be protected if something goes wrong. Take 2 minutes to learn more

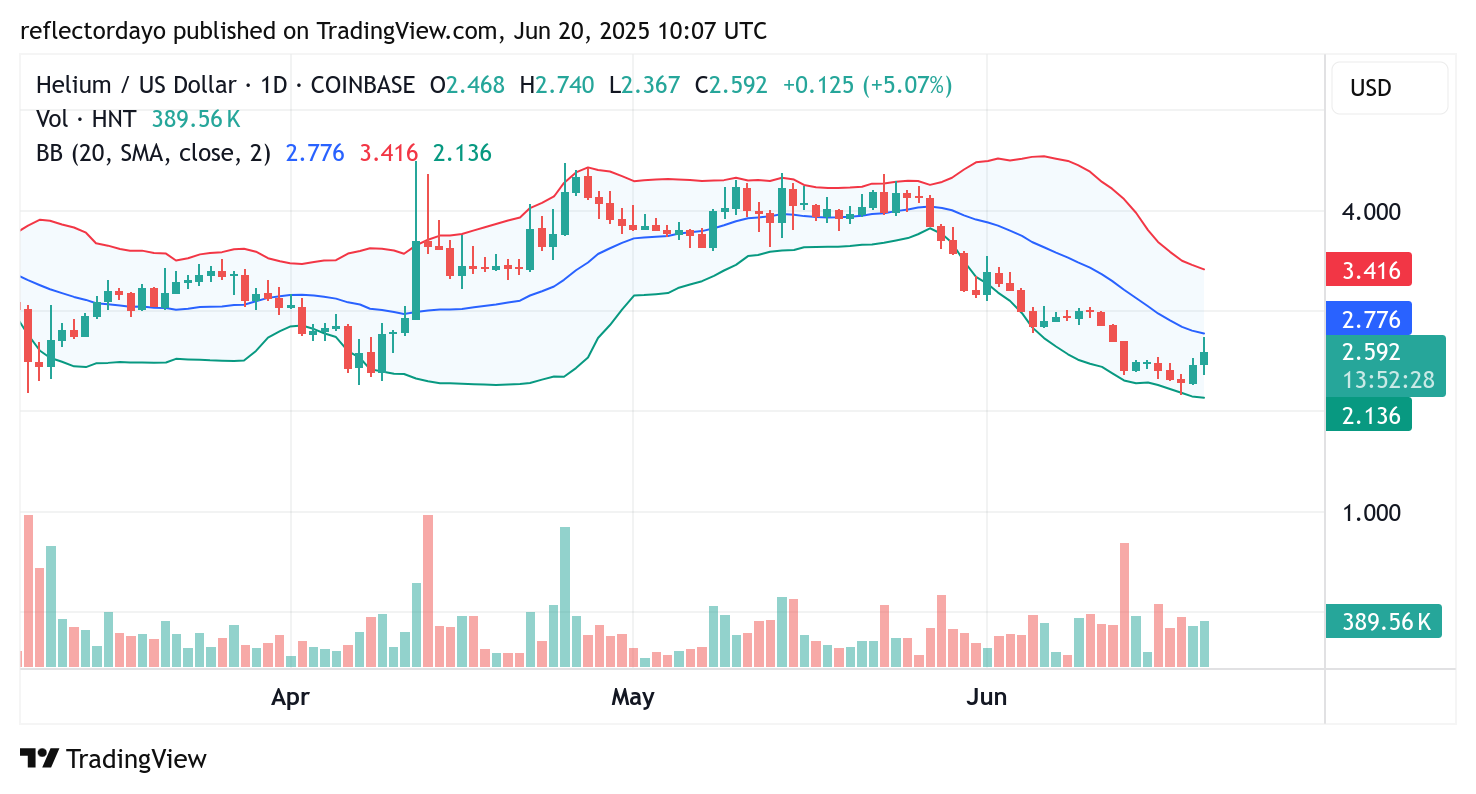
As May came to a close, Helium (HNT/USD) experienced a decisive breakdown below the $4.00 price level, which had previously served as a consolidation zone for an extended period. For a while, both bullish and bearish forces were evenly matched at this level, but eventually, bearish pressure prevailed, sending the market downward toward the $2.00 region.
Before reaching the critical $2.00 support, the price found temporary relief at the $2.30 level—a historically relevant support zone from previous market cycles. This level proved pivotal, halting the downward momentum and sparking renewed buying interest.
From this base, Helium mounted a strong rebound, pushing the price up to approximately $2.77. This rally suggests a possible shift in sentiment, with bulls regaining short-term control. Whether this marks the beginning of a sustained trend reversal in the crypto signals remains to be seen, but the rebound from $2.30 is a positive signal for market participants watching for signs of recovery.
Helium Market Data
- HNT/USD Price Now: $2.60
- HNT/USD Market Cap: 479 million
- HNT/USD Circulating Supply: 187.8 million HNT
- HNT/USD Total Supply: 187.8 million HNT
- HNT/USD CoinMarketCap Ranking: #112
Key Levels
- Resistance: $2.70, $3.00, and $3.50
- Support: $2.00, $1.50, and $1.00
Helium (HNT/USD) Market Outlook: Bullish Recovery Begins, But Uncertainty Lingers
While the recent bullish rebound in the Helium (HNT/USD) market is notable—originating from a historically significant support level around $2.30—it may be premature to conclude a full trend reversal is underway. The bounce from this level has sparked a surge in bullish sentiment, suggesting that momentum could be shifting in favor of buyers.
However, technical indicators point to a more nuanced picture. The candlestick pattern representing today’s trading session, along with the widening Bollinger Bandwidth, reflects heightened volatility and potential indecision in the market. Additionally, price action remains below the 20-day moving average—currently around $2.77—underscoring that the broader bearish trend has yet to be decisively broken.
Moreover, volume histogram analysis reveals strong activity from both buyers and sellers, indicating an ongoing battle between supply and demand forces. Until the price firmly breaks above the 20-day moving average with sustained momentum, the current recovery should be viewed with cautious optimism rather than confirmation of a bullish trend reversal.
In short, Helium is showing early signs of recovery, but key resistance levels must be overcome to establish a clearer bullish trajectory.
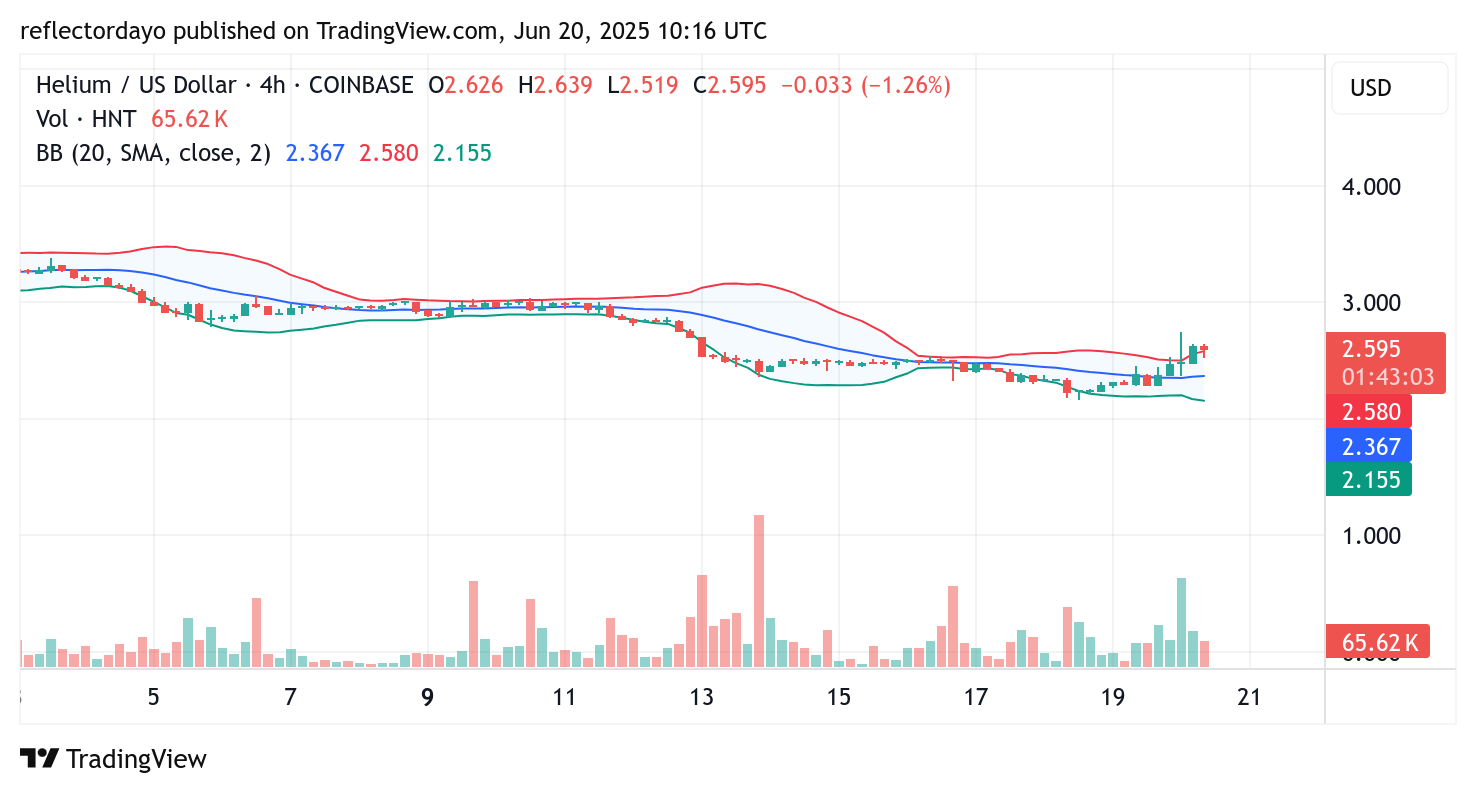
HNT/USD 4-Hour Chart: Bulls Hold Ground, But Momentum Shows Signs of Fatigue
The 4-hour chart perspective reinforces the ongoing recovery in the Helium (HNT/USD) market but also highlights emerging resistance near the $2.70 level. As price action approaches this threshold, signs of exhaustion are becoming apparent, with buying momentum beginning to wane.
This standoff between bullish and bearish forces is reflected in the declining volume histogram, suggesting that traders are becoming increasingly cautious. The reduced trading activity signals uncertainty in the market and a potential pause in the current upward movement.
Given these conditions, a period of consolidation may be likely around the $2.70 zone before the market determines its next directional move. A decisive breakout above this level could reignite bullish momentum, while failure to hold could lead to renewed downward pressure.