Synthetix (SNXUSD) Failed to Break $13.500 Resistance
Estimated Reading Time: 3 minutes
Don’t invest unless you’re prepared to lose all the money you invest. This is a high-risk investment and you are unlikely to be protected if something goes wrong. Take 2 minutes to learn more
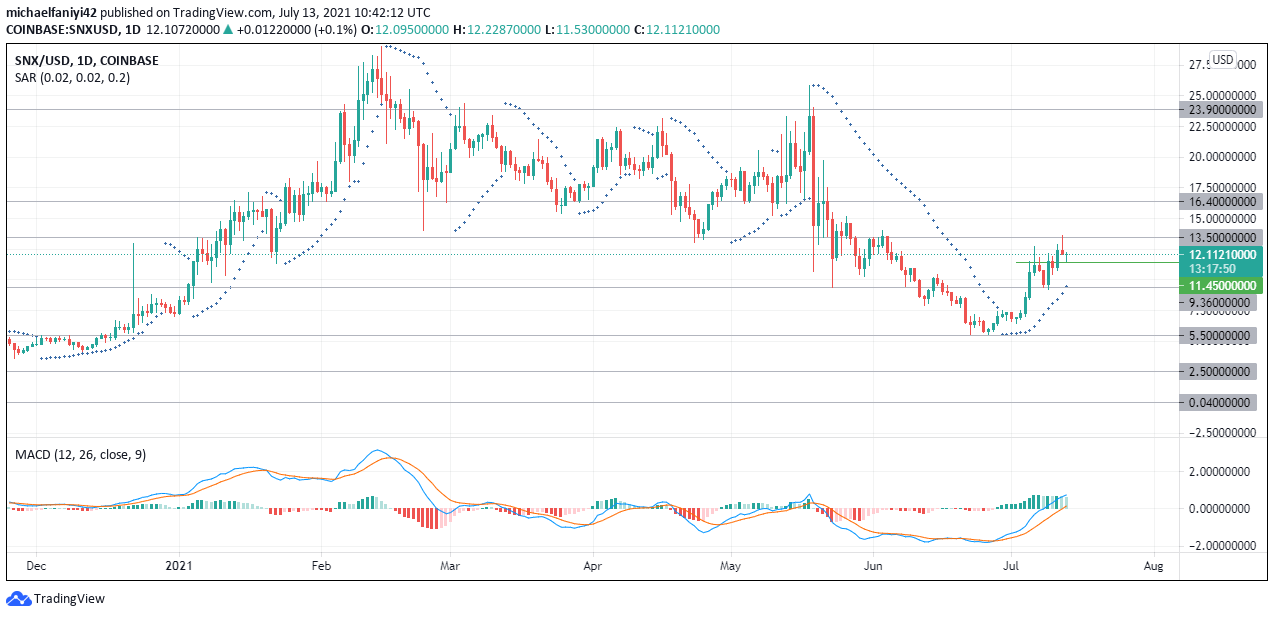
SNXUSD Market Analysis – Price Failed to Break Through $13.500 Barrier
Synthetix failed to break $13.500 at the second time of testing. This is despite the fact that the market had fallen to $9.360 to bounce up. On reaching the resistance, the price was repelled strongly. This can be seen in the bearish inverted hammer candlestick shown.
Synthetix Key Levels
Resistance Levels: $16.400, $13.500
Support Levels: $11.450, $9.360
The last time the Synthetix attempted this key level was early in June. The market had just fallen below it and attempted to rally immediately, but $13.500 defended the price well and it eventually fell to as low as $5.500. It was from this point that SNXUSD began to rally again to make up for lost grounds.
The market displayed an inverted hanging man to show rejection at the $13.500 resistance and the price has dropped. The market is however finding succor around $11.450 to bounce back up. The current daily candle shows market indecision, but price is now trading at $12.098 showing Synthetix is yet having another go at the resistance even without a strong support. Both the Parabolic Stop and Reverse and the MACD (Moving Average Convergence Divergence) support price bullish foray.
Market Prospects
The market closed yesterday with a hammer candlestick on falling to $9.360 support on the 4-hour chart. This shows market reversal and currently the market has moved up a little. Generally, the market is climbing an ascending trend line which started on the 2nd of July 2021. 
The Parabolic SAR reflects the draw back in price with 5 dots stationed above the 4-hour chart. This is the same situation with the MACD indicator. Its current histogram bars are bearish, however, its signal line which are still above the zero level give the bulls cause for optimism.
SNXUSD will attempt to test the $13.500 resistance again with the hope of reaching $16.400, but without a strong support, their foray is unlikely and SNX could fall back to $9.360.
You can purchase crypto coins here. Buy Tokens
Note: Cryptosignal.org is not a financial advisor. Do your research before investing your funds in any financial asset or presented product or event. We are not responsible for your investing results.