Binance Coin Regains the Bullish Momentum, Revisits the $440 High
Estimated Reading Time: 2 minutes
Don’t invest unless you’re prepared to lose all the money you invest. This is a high-risk investment and you are unlikely to be protected if something goes wrong. Take 2 minutes to learn more

Free Crypto Signals Channel
Binance Coin (BNB) Long-Term Analysis: Bullish
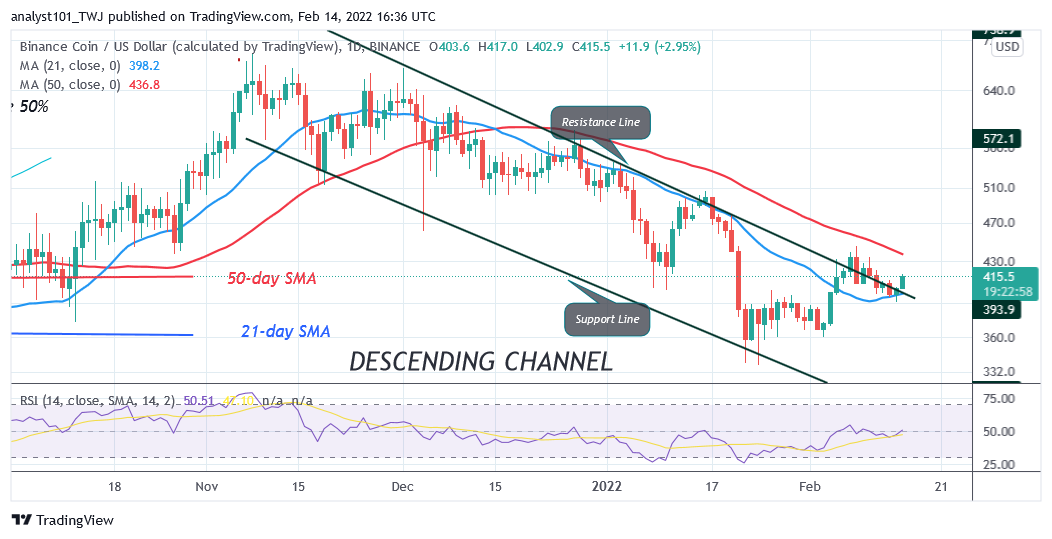
Binance Coin’s (BNB) price is in an upward move as it revisits the $440 high. The bulls have broken above the 21-day line moving average but faces rejection at the $440 resistance zone. The cryptocurrency has retraced to the support above the 21-day line moving average. Today, the support is holding as the market resumes upward. On the upside, if the bulls break above the 50-day line moving average, the altcoin will rally to $510 or $600. Conversely, if the bulls fail to break above the 50-day line moving average, the altcoin will be compelled to a range-bound move between the moving averages.
Binance Coin (BNB) Indicator Analysis
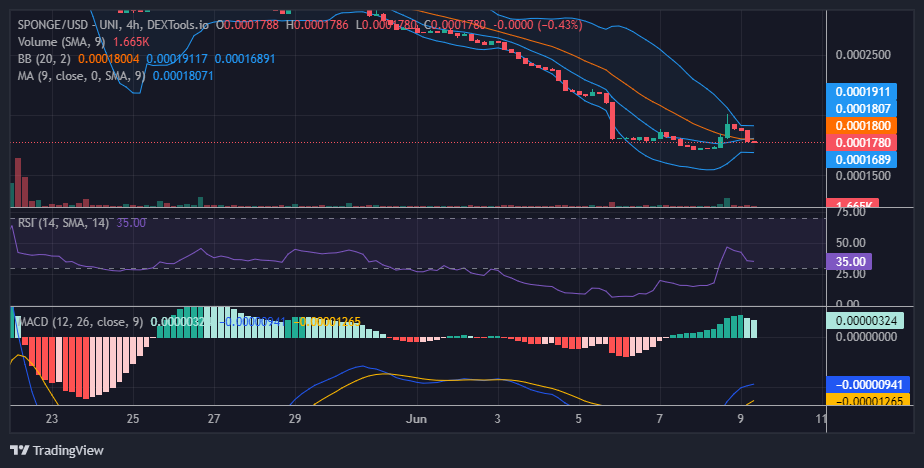
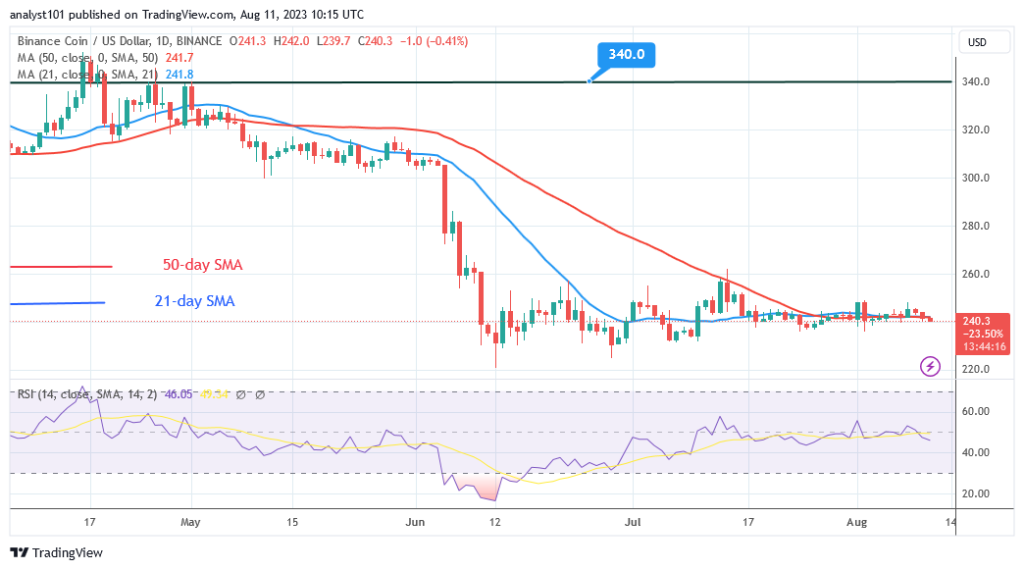
BNB/USD is at level 53 of the Relative Strength Index period 14. The altcoin is in the uptrend zone and capable of a further upward move. The crypto’s price is above the 21-day SMA but below the 50-day SMA indicating a possible price fluctuation. The bulls are approaching the 50-day line moving average to break above it. BNB is above the 50% range of the daily stochastic. Binance Coin has resumed bullish momentum.
Technical indicators:
Major Resistance Levels – $640, $660, $680
Major Support Levels – $540, $520, $500
What Is the Next Direction for Binance Coin (BNB)?
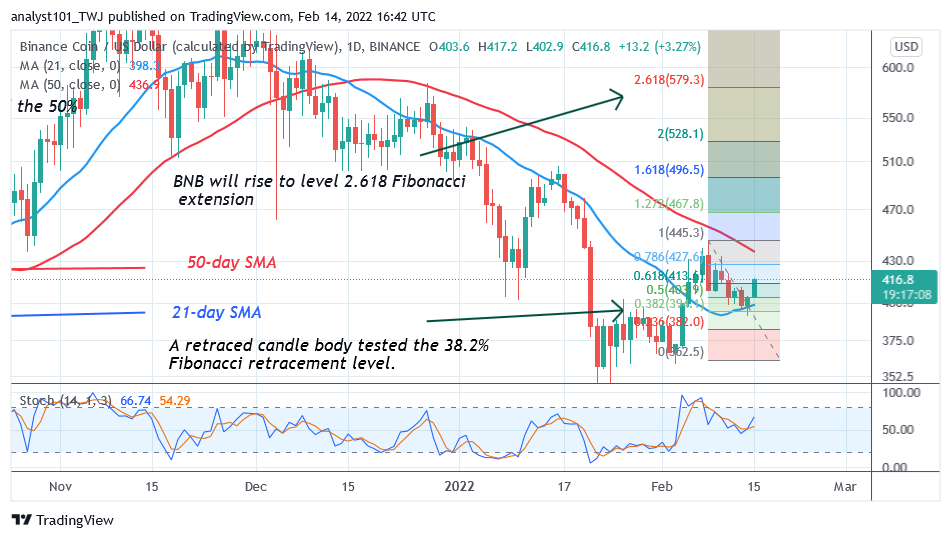
Binance Coin is approaching the 50-day line moving average as it revisits the $440 high. On February 8 uptrend; a retraced candle body tested the 38.2% Fibonacci retracement level. The retracement indicates that BNB will rise to level 2.618 Fibonacci extension or $579.30. From the price action, the bulls are approaching the resistance at $440 to break it. The Fibonacci tool analysis will hold if the resistance is breached.
You can purchase crypto coins here. Buy Tokens
Note: Cryptosignals.org is not a financial advisor. Do your research before investing your funds in any financial asset or presented product or event. We are not responsible for your investing results