Raydium (RAY/USD) Experiences Notable Price Surge Amid Positive Developments
Estimated Reading Time: 3 minutes
Don’t invest unless you’re prepared to lose all the money you invest. This is a high-risk investment and you are unlikely to be protected if something goes wrong. Take 2 minutes to learn more
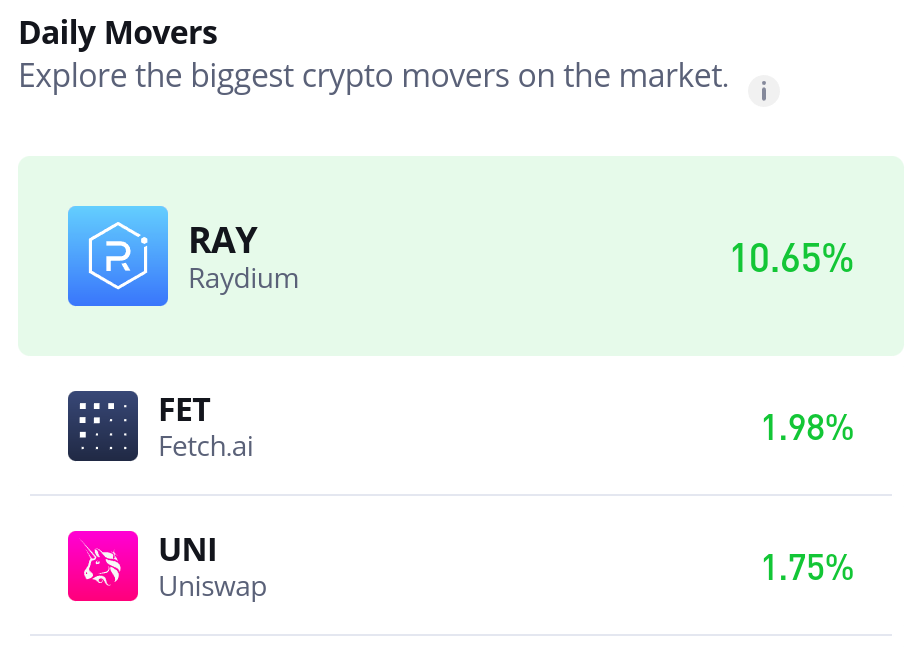
Raydium (RAY/USD) has recently experienced a significant price surge of approximately 10–15%, driven by a combination of favorable market developments. Among the catalysts are the token’s recent listings on major exchanges such as Upbit and a series of protocol buybacks, both of which have attracted renewed interest from institutional and retail investors alike.
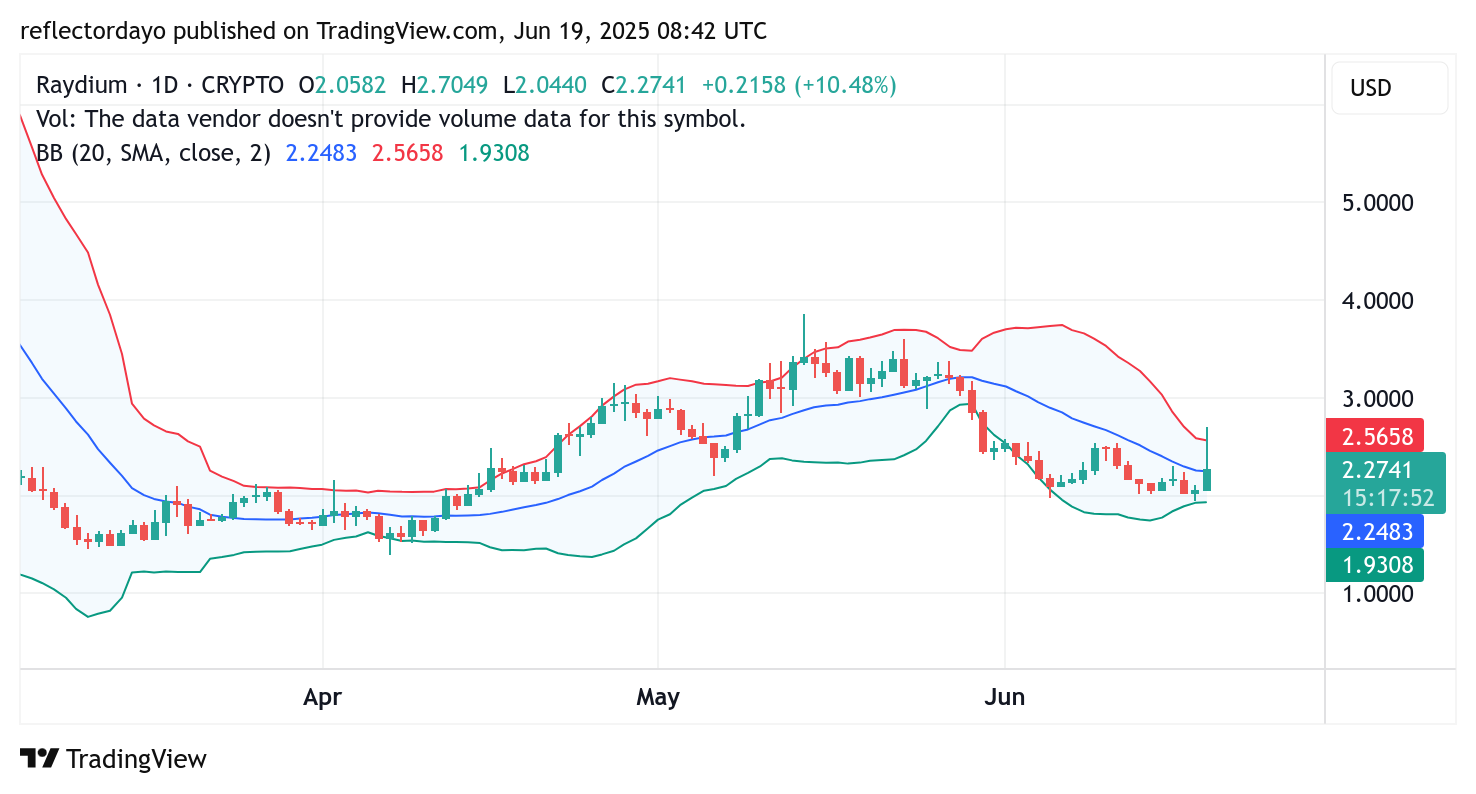
The $2.00 price level has emerged as a key support zone, serving as the foundation for the ongoing upward move. Earlier in the day, RAY/USD rallied toward the $3.00 mark but encountered resistance near $2.67, prompting some traders to take profits. This profit-taking activity led to a slight retracement, bringing the price down to its current trading area around $2.27.
Despite the pullback, the market remains structurally bullish in the short term, with investor sentiment showing signs of optimism amid growing ecosystem engagement and technical momentum.
Raydium Market Data
- RAY/USD Price Now: $2.27
- RAY/USD Market Cap: $600 million
- RAY/USD Circulating Supply: 267 million RAY
- RAY/USD Total Supply: 554.99 million RAY
- RAY/USD CoinMarketCap Ranking: #100
Key Levels
- Resistance: $2.60, $3.00, and $3.50
- Support: $2.00, $1.50, and $1.00
Raydium Market Outlook: Consolidation Emerges as Bulls Test Key Resistance Levels
Since the broader market downturn pushed Raydium to the $2.00 price level, bullish momentum has gradually re-emerged. This recovery has led to a consolidation pattern forming around the $2.00 zone, signaling an early phase of accumulation. Following a recent upward move, the price corrected back to the $2.20 area—aligning closely with the 20-day moving average.
Despite the recent notable rally, the overall market remains within a bearish framework. Bears still maintain a level of control, and a decisive break above the $2.50 resistance level is required to validate a full trend reversal. Achieving this may prove challenging for bullish traders, especially as volatility remains high, making the $2.50 level susceptible to price rejection.
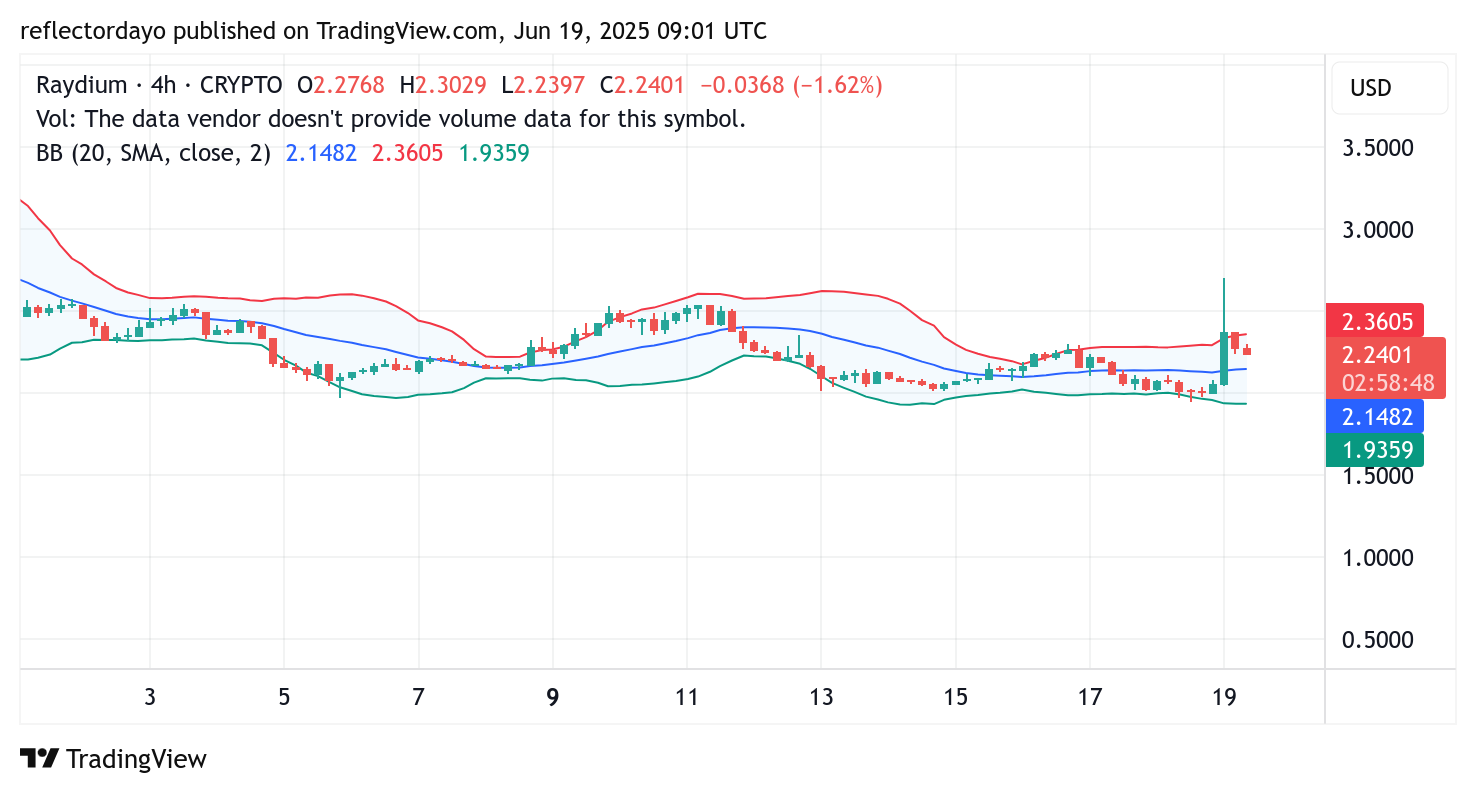
RAY/USD 4-Hour Chart: Bulls Hold the Line as Momentum Wavers
From a 4-hour chart perspective, Raydium appears to be entering a consolidation phase as bullish forces attempt to defend the $2.25 zone. The latest bearish candlestick has lost significant volume, bottoming out near $2.245—suggesting weakening downward momentum.
However, if the market fails to hold above this level, a break below $2.20 could potentially drag the price back toward the $2.00 threshold. Such a move would effectively nullify the bullish progress made during the recent rally and reinforce the prevailing bearish trend.