Swell Network (SWELL/USD) Market Outlook: Signs of Accumulation Point Toward Potential Rebound
Estimated Reading Time: 4 minutes
Don’t invest unless you’re prepared to lose all the money you invest. This is a high-risk investment and you are unlikely to be protected if something goes wrong. Take 2 minutes to learn more
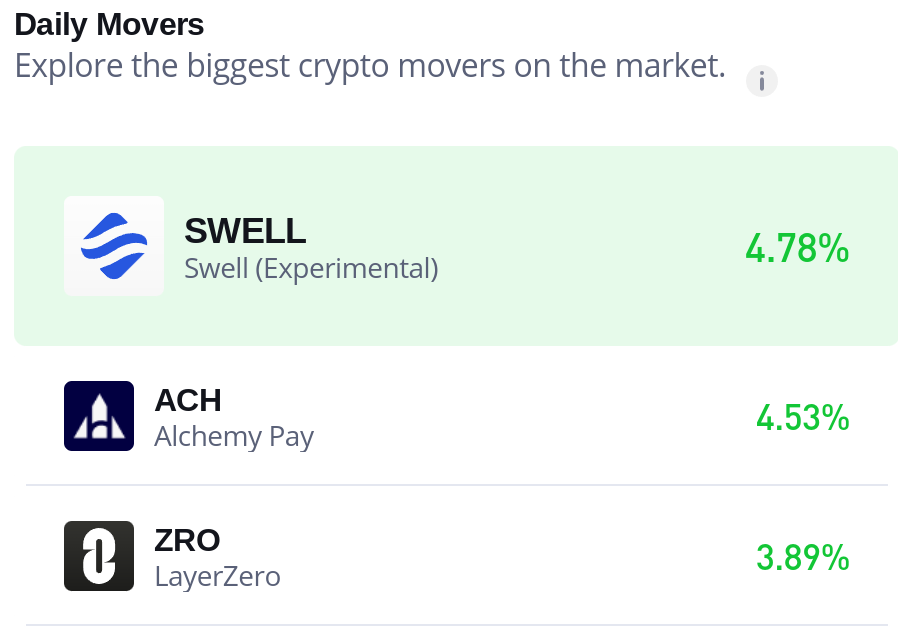
Despite a 4.8% gain in today’s trading session, the Swell Network continues to trade within a broader bearish zone. The prevailing candlestick on the daily chart still reflects bearish dominance, suggesting that sellers remain in control for now.
However, technical indicators on the daily chart are beginning to show early signs of a potential shift. There is a visible convergence of both upper and lower price levels around the $0.0082 zone, which appears to be forming a strong support base.
This consolidation around key support may indicate that the market is entering an accumulation phase. A sustained hold above this zone could pave the way for a bullish reversal. While a rebound may be on the horizon, the market may first need to stabilize around the $0.0082–$0.0048 range before making a meaningful move toward the $0.008 mark.
Swell Network Market Data
SWELL/USD Price Now: $0.0084
SWELL/USD Market Cap: $17.5 million
SWELL/USD Circulating Supply: 2.1 billion SWELL
SWELL/USD Total Supply: 10 billion SWELL
SWELL/USD CoinMarketCap Ranking: #867
Key Levels
- Resistance: $0.0090, $0.0100, and $0.01200
- Support: $0.0080, $0.0075, and $0.0700
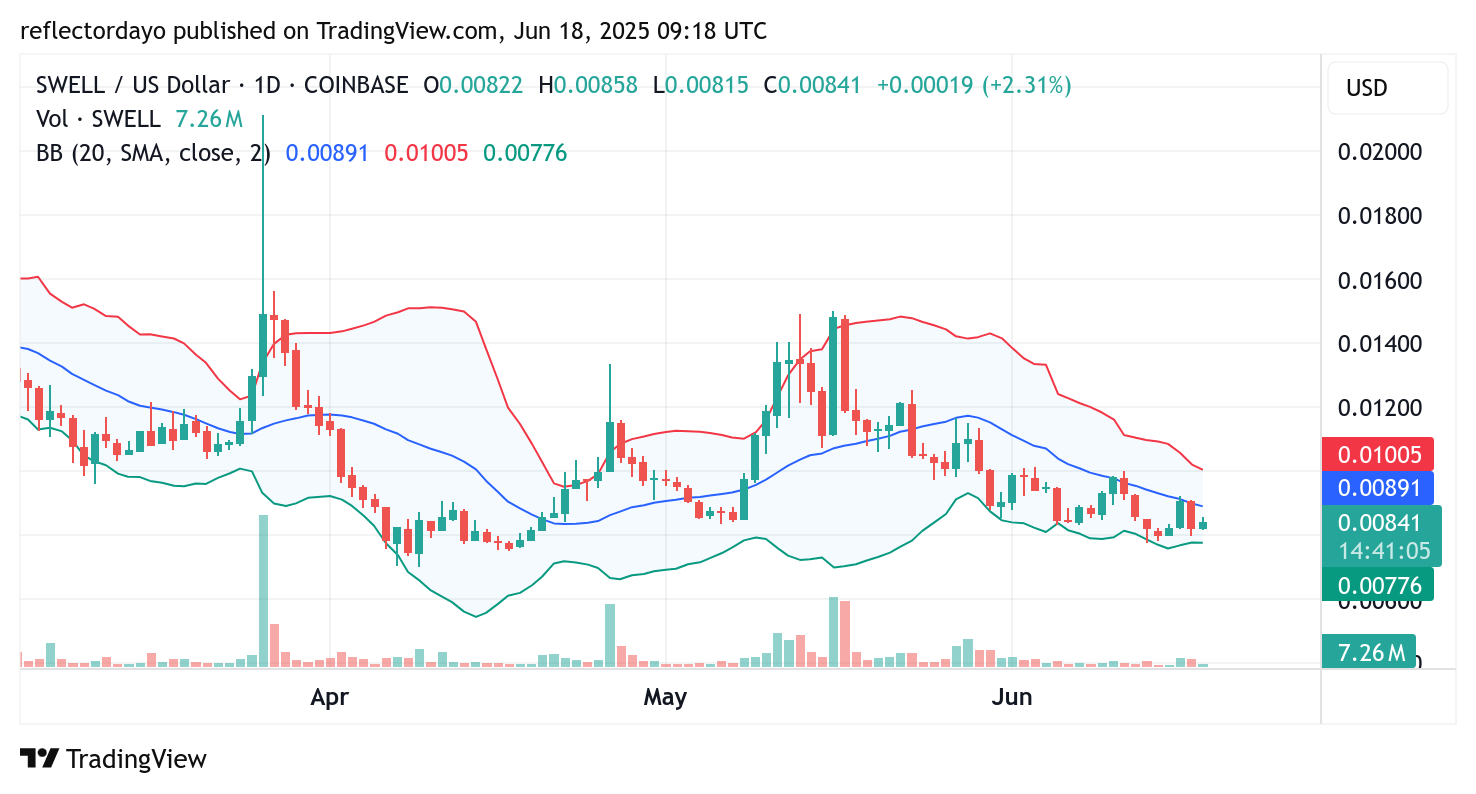
Swell Network (SWELL/USD) Technical Outlook: Falling Wedge Pattern Signals Imminent Rebound
The Swell Network is beginning to show early signs of a potential bullish reversal, particularly through the lens of technical indicators. Notably, the Bollinger Bands are currently forming a falling wedge pattern—a classic bullish signal in the crypto market. The two standard deviation curves are narrowing, with both the upper and lower bands converging near the $0.008 price level, suggesting decreasing volatility and a potential breakout ahead.
This $0.008 zone holds historical relevance, as it previously acted as a strong support level. For instance, a notable bounce occurred from this area on May 8, reinforcing the likelihood of bullish sentiment re-emerging around this price.
While the current formation indicates a probable bounce—or at the very least, a consolidation phase—traders should remain cautious. If bullish momentum fails to build and sellers regain control, a breakdown below this support could lead to renewed downward pressure. Still, for now, the technical setup leans in favor of a potential rebound from this critical zone.
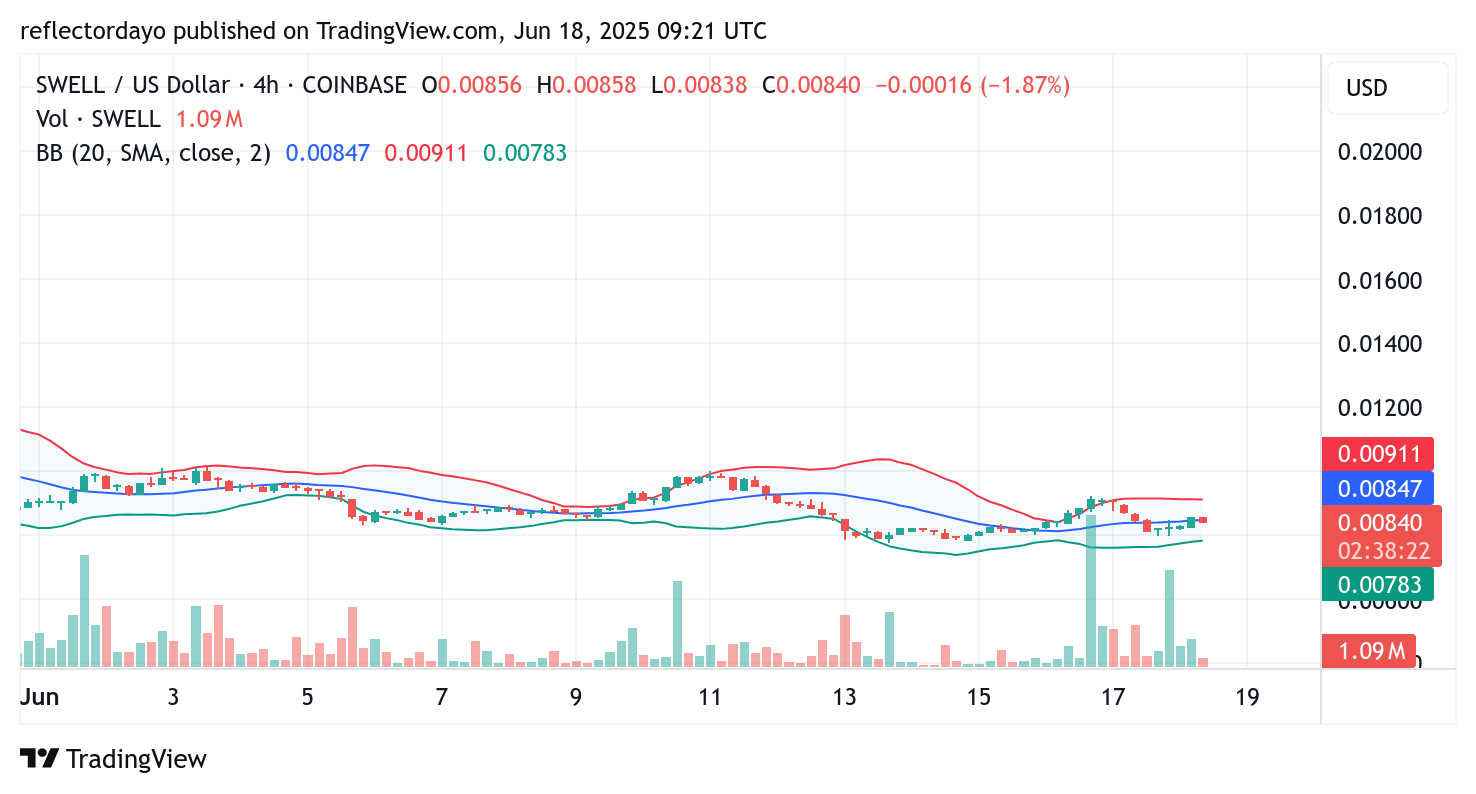
SWELL/USD 4-Hour Chart Analysis: Consolidation Looms as Bearish Pressure Softens
The SWELL/USD market recently made an attempt to break above the 20-day moving average but was rejected right at the threshold, signaling persistent resistance at that level. While buyers are showing signs of activity, they have not yet gained enough momentum to push through.
From a 4-hour chart perspective, the price action appears to be hovering near equilibrium, suggesting the market may be entering a consolidation phase. This balance between buyers and sellers reflects market indecision.
Although the bearish momentum appears to be weakening, there is still no clear evidence of a full trend reversal. The current setup could either mark a pause in the prevailing downtrend or the early stages of a more substantial retracement. Traders should watch closely for a breakout or breakdown from the current range to confirm the next directional move.