XRP (XRP/USDT) Record a Minor Gains Amidst Market Conditions
Estimated Reading Time: 3 minutes
Don’t invest unless you’re prepared to lose all the money you invest. This is a high-risk investment and you are unlikely to be protected if something goes wrong. Take 2 minutes to learn more

XRP Long-term Analysis: Bullish
The market for XRP against the Tether has seen a strong bullish breakout in previous trades around the fourth quarter of last year, rallying up with higher highs. However, the pair’s price has been dwindling since hitting above $2.5000, indicating the presence of bearish traders in the market.
Recently, the pair’s price saw a gain of 1.78%. Could it be the needed motivation for the re-entrance of bullish traders or a prolonged consolidation signal?
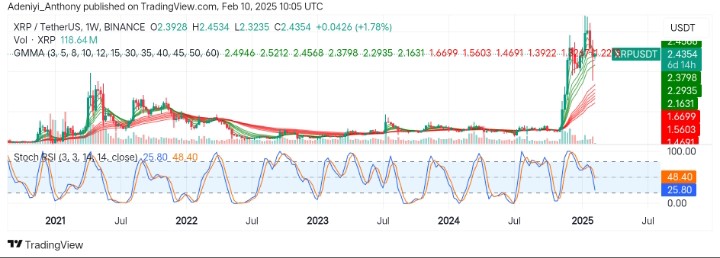
Currently, XRP trades at $2.4354 with over 118 million traded volumes for the week.
Technical Indicators
Major Resistance Levels: $2.4568, $2.8000, and $3.3000
Major Support Levels: $2.1631, $1.6699, and $1.3922
XRP Technical Analysis
On the weekly timeframe, XRP against the Tether appears to have seen an increased trading volume with little gain, indicating a potential renewed interest. However, the pair is at a critical juncture, with potential bullish continuation as suggested by the Guppy Multiple Moving Averages (GMMAs).
On the chart, the Stochastic RSI presents the opposite possibility, as momentum seems to be dropping. This suggests that despite the recent rise in price, sellers are actively participating to pull it down.
To this end, the $2,1631 becomes the level that could lead to a bearish crossover, while a sustained hold would indicate a bullish continuation.
XRP/USDT Analysis: Where from Here?
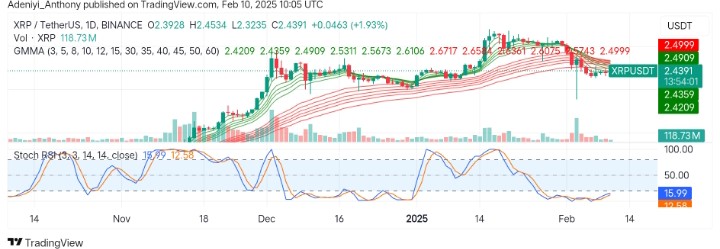
On the daily timeframe, XRP/USDT appears to be in a corrective phase after a little bullish uptick. The intertwined GMMAs suggest the pair’s price is stabilizing with more of the longer-period EMAs trending upward.
However, the Stochastic oscillator signals an oversold condition with the lines pointing to the north. This suggests a potential bounce if buying interest improves.
To this end, a retest of the $2.5000 resistance is possible if the price holds above $2.4209; otherwise, a break below this point would pave the way for a move towards $2.3000, which may be another re-entry point for the bullish traders.
You can purchase crypto coins here. Buy LBlock