Chainlink (LINK/USD) Advance Towards $8.179 Support Level
Estimated Reading Time: 3 minutes
Don’t invest unless you’re prepared to lose all the money you invest. This is a high-risk investment and you are unlikely to be protected if something goes wrong. Take 2 minutes to learn more

Chainlink Long-term Analysis: Bearish
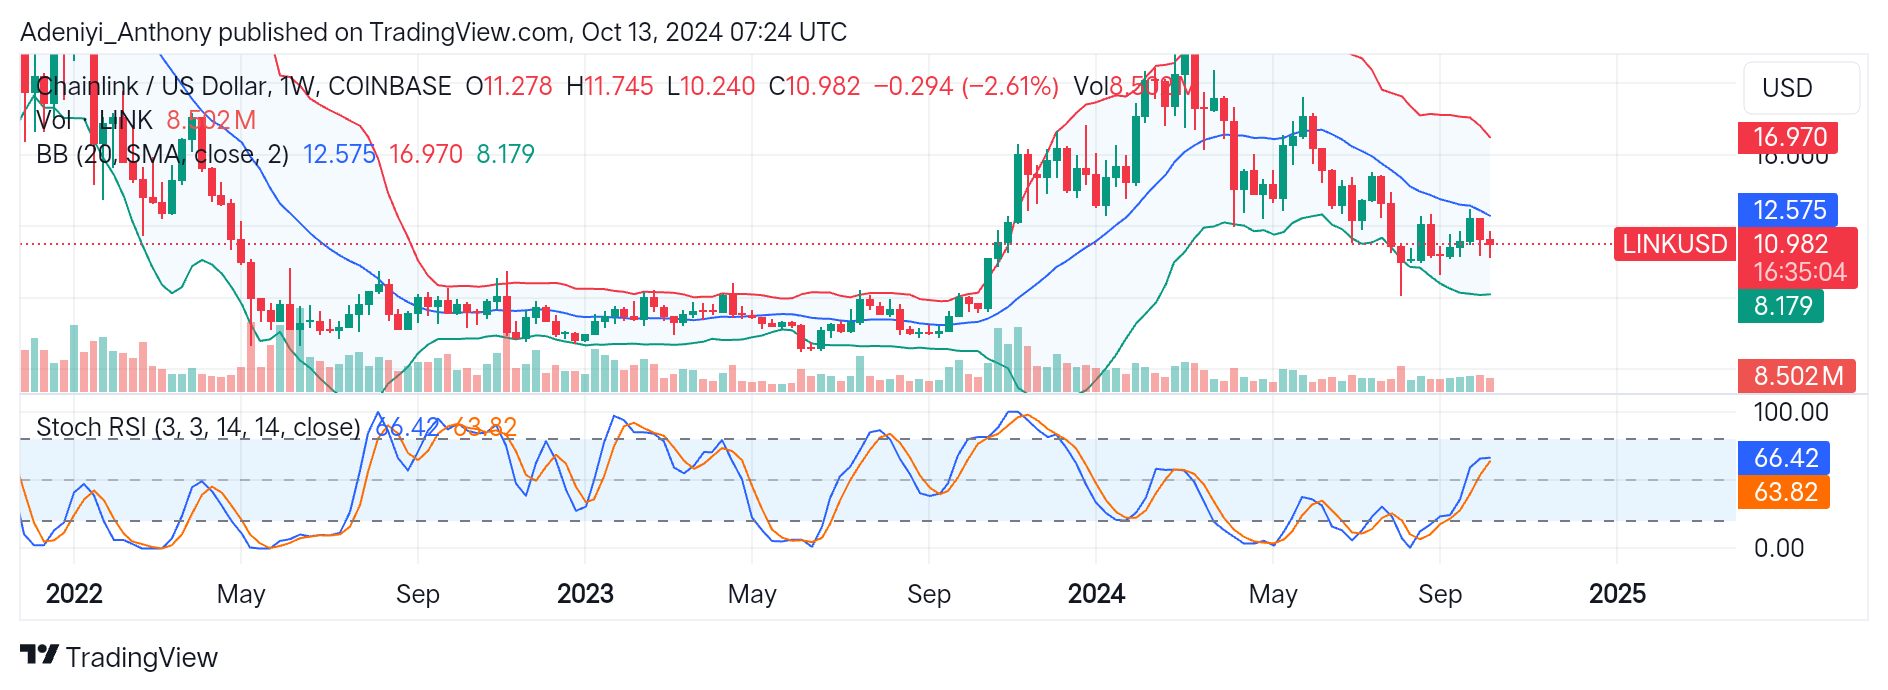
The LINK/USD after short-term correction to the middle Bollinger band seems to be consolidating within a defined range. Despite this, the overall market analysis remains bearish.
The stochastic Relative Strength Index (RSI) suggests a potential bullish momentum. However, the Bollinger bands indicate reduced volatility. The previous price moments seem to be between the $12 and $8 level with clear short-term upside correction and downside retracement.
The current trading volume is 8.502M, which is relatively low compared to what is needed for a breakout in either direction to take place. This suggests the current market condition is without direction.
At present, LINK/USD trades at $10.982. However, the previous candlestick suggests rejection at the $12.575 level, and a potential short-term retracement to the Lower Bollinger band is possible.
Technical Analysis
Major Resistance Levels: $11.745, $12.575, and $16.970
Major Support Levels: $10.240, $9.000, and $8.179
Chainlink Technical Indicator Analysis
The Chainlink against the U.S. dollar is consolidating between narrow levels as specified by the bands. The 8.502M trading volume in the market suggests the market lacks significant participation from the traders.
The Stochastic RSI, on the other hand, suggests the pair is in a neutral position, indicating the availability of room for movement in any direction. However, for a clear direction to be confirmed, there must be a spike in the trading volume.
Chainlink Tend Analysis: Where From Here?
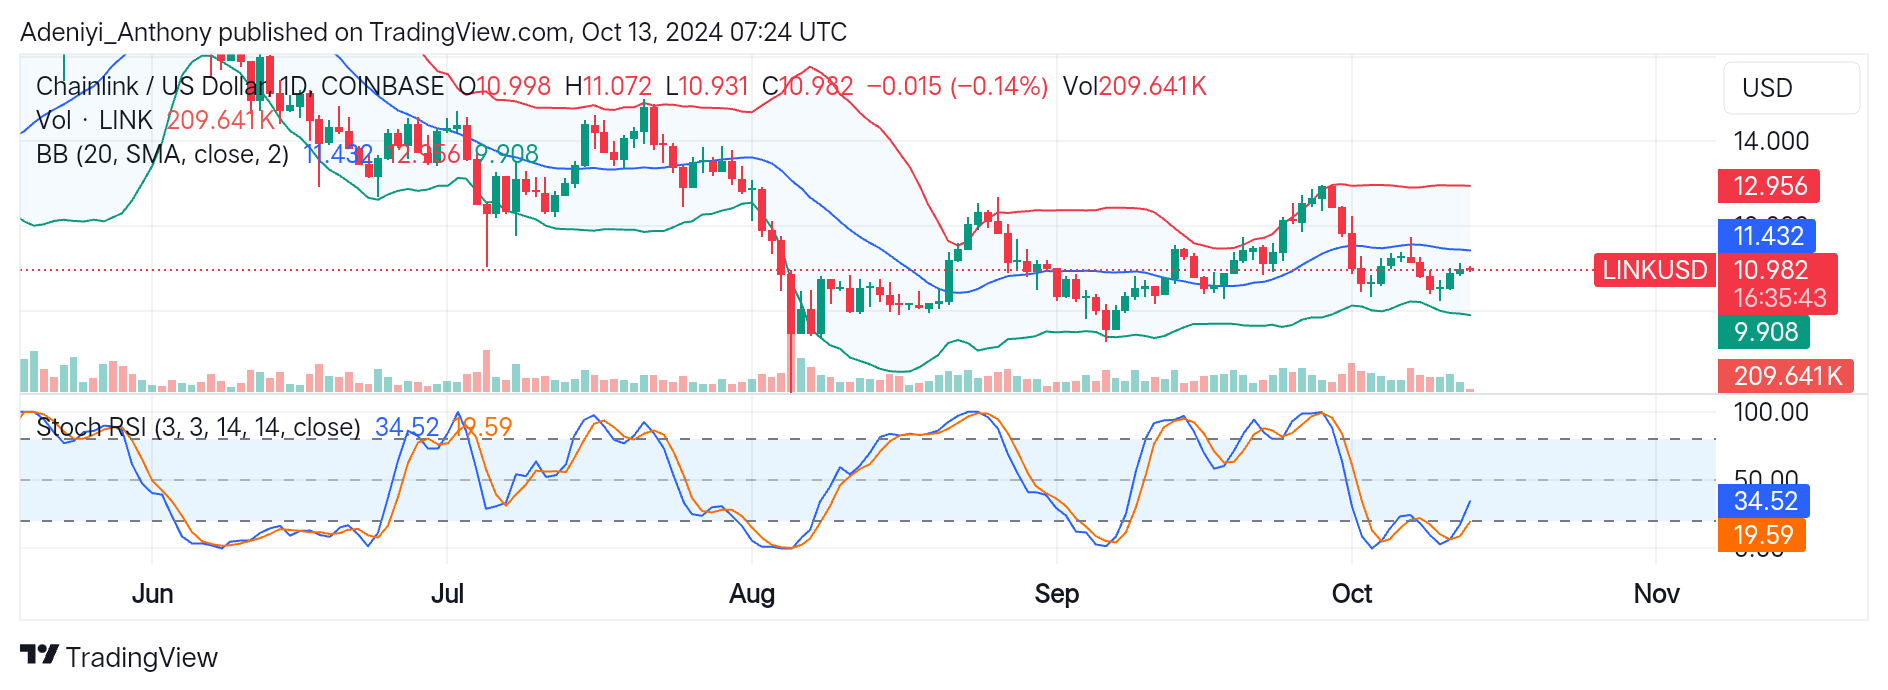
On the daily timeframe, the LINK/USD appears to be in a range-bound movement, with most recent price movements in between the lower and middle Bollinger bands. At present, the market is not showing any clear direction, but there exists a 0.14% decrease in price from the previous candlestick.
On the downside of the chart, the Stochastic oscillator suggests the pair is moving away from the oversold region. However, this is not enough to confirm a bullish reversal without increased trading volume and a heavy bullish presence in the market.
Currently, in this timeframe, the pair trades at $10.982, and a spike in volume increases the likelihood of breaking out from the $11.432 level or breaking down from the $9.908 level.
You can purchase crypto coins here. Buy LBlock