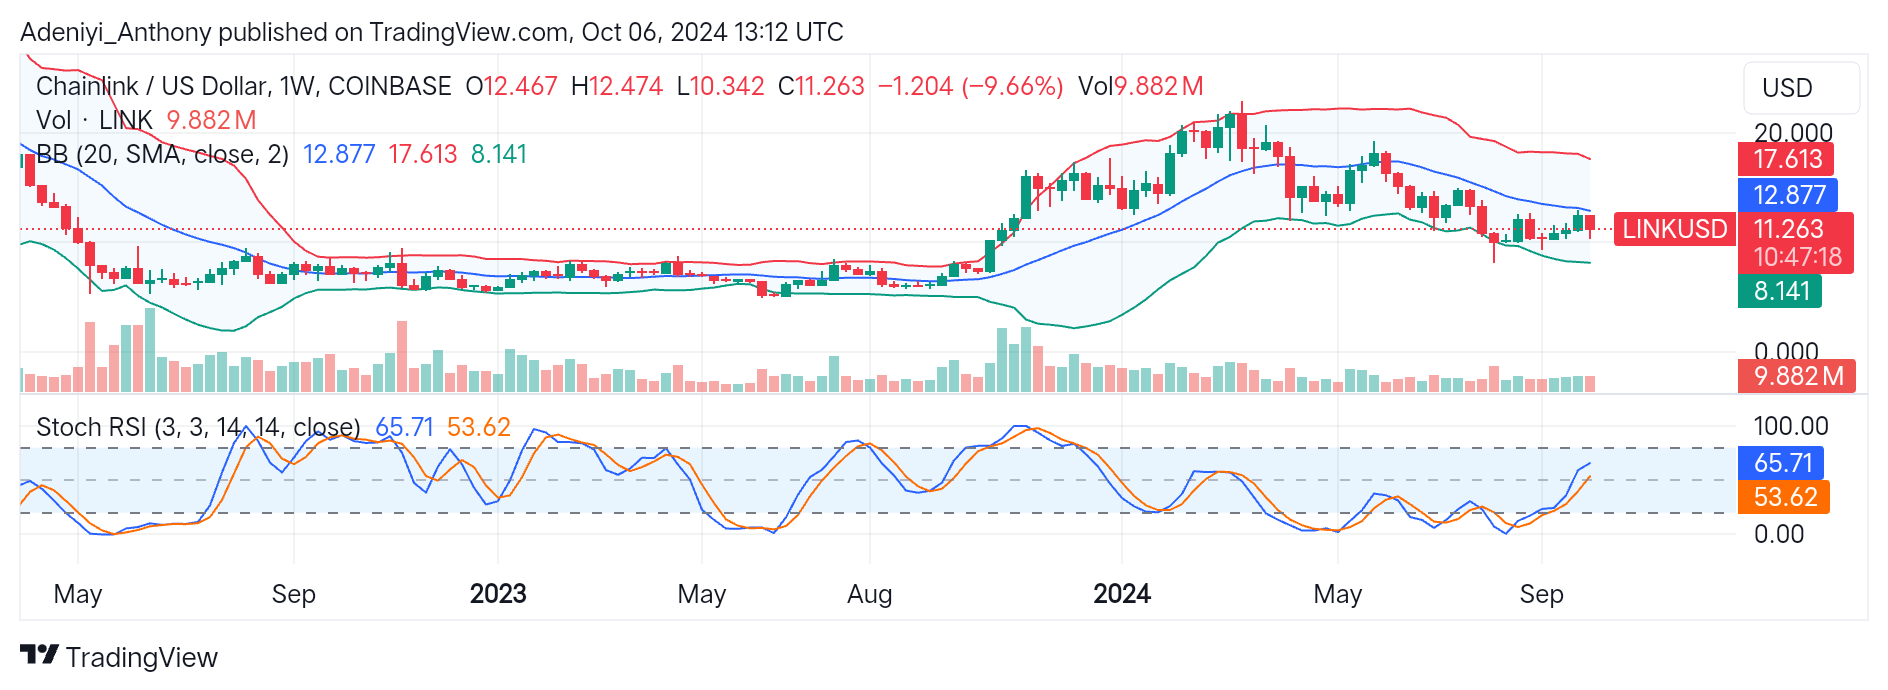
Chainlink (LINK) Tested the $12.877 While Consolidating
Estimated Reading Time: 3 minutes
Don’t invest unless you’re prepared to lose all the money you invest. This is a high-risk investment and you are unlikely to be protected if something goes wrong. Take 2 minutes to learn more

Chainlink Long-term Analysis: Bearish
The Chainlink (lINK/USD) on the weekly chart shows a bearish sentiment in the broader sense despite ranging activities below the middle Bollinger band. The 9.66% drop in price from the last week’s high suggests bearish pressure in the market.
Presently, the distance of the Bollinger band is reducing. However, the trading volume remains relatively high at 9.882 million, but there are more sellers than buyers.
Currently, Link is trading at $11.263 below the middle Bollinger band dynamic level at $12.877. However, the Stochastic Relative Strength Index (RSI) suggests the pair is nearing the overbought position. This indicates there might be a short-term pullback or continued downtrend unless countered by enough buying pressure.
The range-bound activities around $8.141 suggest that LINK/USD is looking for a good support level. Two scenarios may play out here. First, if the price breaks below the $8 level, it may break further support levels. Contrarily, if prices rebound, it may aim for the $12.877 level, which might lead to testing of further resistance levels.
Technical Indicators
Major Resistance Levels: $12.877, $17.610, and $20.000
Major Support Levels: $10.341, $8.141, and $6.000
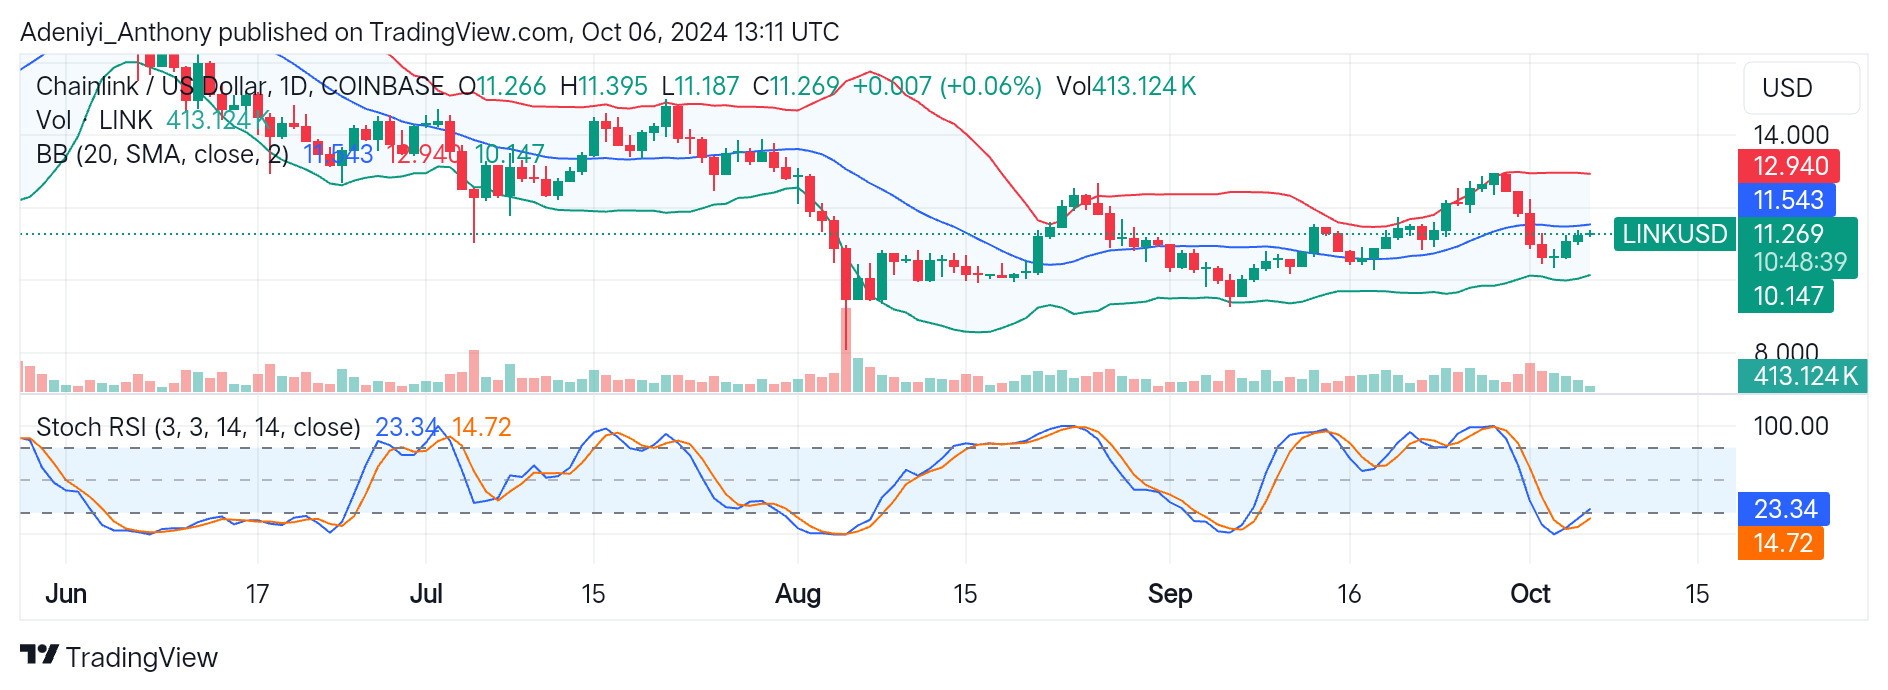
Chainlink Technical Indicator Analysis
The price action close to the middle band suggests the pair recently tested the $12.877 level and is heading towards the lower band at $8.141. However, the next direction of the coin will be determined by what happens at the lower band.
On the other hand, the Stochastic RSI indicates the pair is trading near the overbought zone. However, with a slightly high volume, a continued downtrend is guaranteed if the buying pressure weakens. On the contrary, the presence of more bulls with a spike in trading volume in the market will push the price upward.
Chainlink’s Next Direction
On a shorter timeframe, LINK/USD appears to be preparing for some kind of big move under the middle Bollinger band, with the current price at $11.269. However, the Stochastic RSI on the downside of the chart suggests that the indecisiveness of the traders seems to be ending soon. The oversold condition in the market indicates that if the bullish strength increases, the pair could break out of the resistance level.
Conversely, if the buyer fails to maintain the current support level, the pair may reverse the south, breaking support levels on the way.
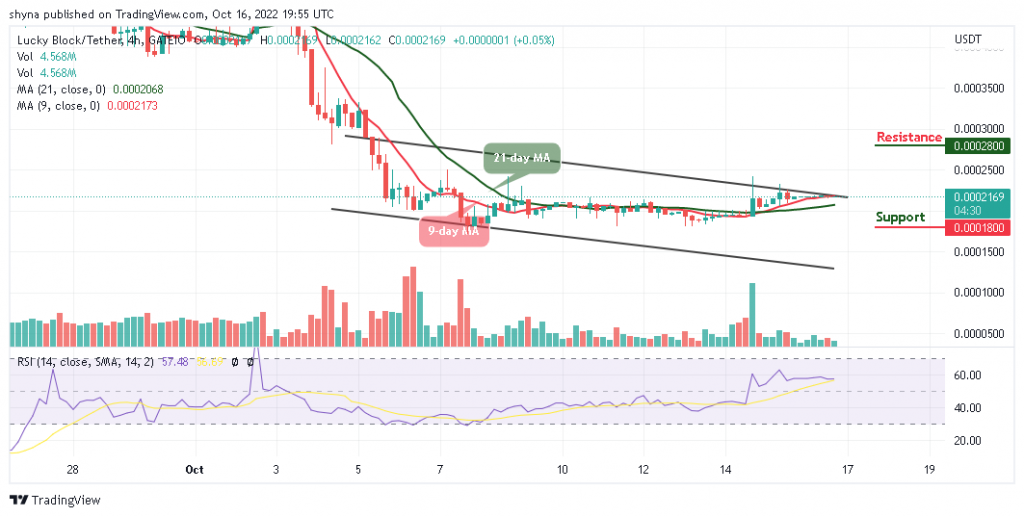
You can purchase crypto coins here. Buy LBlock