XRP (XRP/USDT) Struggles to Hold Support at $2.5200
Estimated Reading Time: 3 minutes
Don’t invest unless you’re prepared to lose all the money you invest. This is a high-risk investment and you are unlikely to be protected if something goes wrong. Take 2 minutes to learn more
XRP Long-term Analysis: Bearish
The market for XRP against the Tether is currently in a downtrend after a strong bullish momentum, breaking supports and forming new lows. However, bullish traders await clear reversal signs as the coin targets the $2.5200 support level.
Recently, XRP surged to a new high, after which a retracement followed. The Stochastic RSI indicates that previous momentum is waning, suggesting a potential further decline unless strong support holds.
Currently, XRP trades at $2.5607 with a 0.74% price decline for the week.
Technical Indicators
Major Resistance Levels: $2.6000, $2.7874, and $2.8000
Major Support Levels: $2.5200, $2.2936, and $2.1452
XRP Technical Analysis
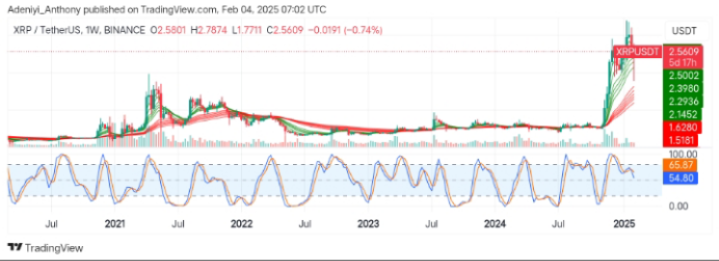
On the weekly timeframe, XRP against the Tether appears to be pulling back after a sharp move above $2.6000 in previous trades. However, the position of the price amidst the Guppy Multiple Moving Averages (GMMAs) suggests the market hope is still on, as the short-term EMAs are positioned above the long-term EMAs despite the price decline.
On the other hand, the Stochastic RSI suggests waning momentum as the lines at 65.87 and 54.80 signal a bearish crossover. To this end, for a reversal to take place, the pair must hit above $2.7874; otherwise, a break below $2.5200 suggests a further dip.
XRP/USDT Analysis: Will the Downtrend Continue or Rebound?
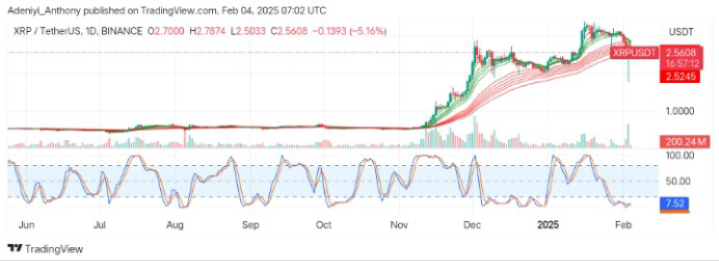
On the daily timeframe, XRP/USDT is showing a sharp price dip as the GMMAs converge, after realizing a 5.16% fall in value from the opening price. At this juncture, the price has lost key moving averages, hovering between the long-term EMAs. However, with the increasing volume, selling pressure may continue.
On the other hand, the oscillator at the bottom of the chart signals an oversold condition, indicating the possibility of a further downtrend or an imminent bounce in the near term.
To this end, the price needs to reclaim $2.6200 with strong bullish volume; otherwise, with the continuation of the current trend, a break below $2.5245 with the suspended lines of the oscillator would indicate a continued downtrend.
You can purchase crypto coins here. Buy LBlock