Tamadoge (TAMAUSD) Sets the Stage for Bullish Price Action
Estimated Reading Time: 2 minutes
Don’t invest unless you’re prepared to lose all the money you invest. This is a high-risk investment and you are unlikely to be protected if something goes wrong. Take 2 minutes to learn more
The present price movement of TAMAUSD remains within a price channel defined by the lower limit of $0.000800 and the upper limit of $0.000900. Of particular note is the event on August 25 when the Tamadoge market located its support beneath the $0.000800 threshold. This prompted an ascending price trend that culminated in surpassing the $0.00090 level. Subsequent to attaining this market peak of $0.00094, a retracement unfolded, resulting in the market readjusting below the $0.000900 mark.
Key Levels
- Resistance: $0.015, $0.016, and $0.017
- Support: $0.0080, $0.0070, and $0.0065
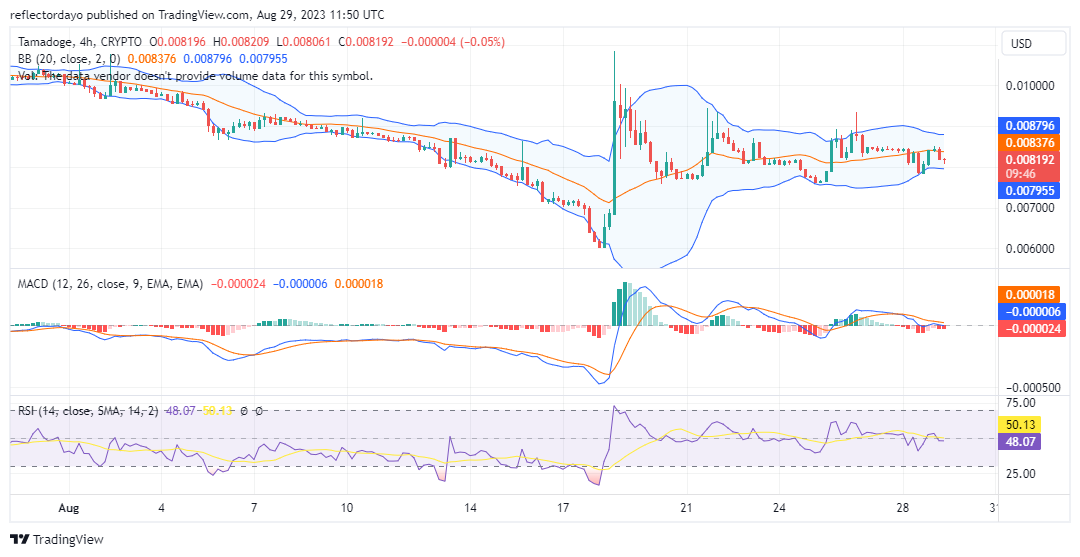
TAMAUSD Price Analysis: The Indicators’ Point of View
Upon analyzing the technical indicators, namely the Relative Strength Index (RSI) and the Moving Average Convergence and Divergence (MACD), an equilibrium state becomes apparent within the TAMAUSD market. The RSI line situates itself at the midpoint of the indicator, indicating a harmonious equilibrium between buying and selling pressures. Concurrently, the MACD lines and histograms exhibit convergence in the vicinity of the zero level, indicating the possibility of convergence between short-term and long-term trends.
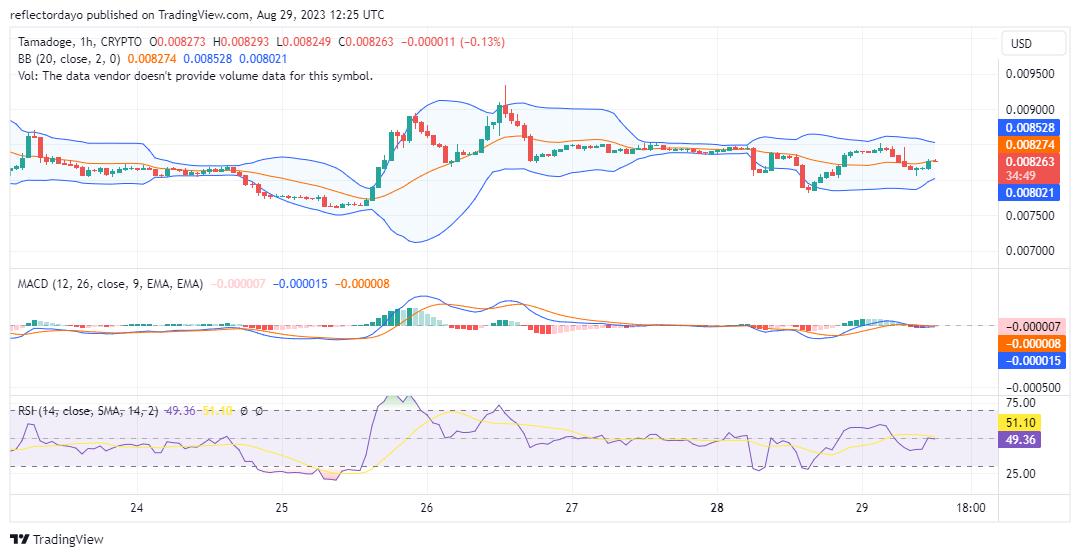
Tamadoge Short-Term Outlook: 1-Hour Chart
The TAMAUSD market is currently exhibiting equilibrium on the 4-hour chart timeframe. However, on the 1-hour chart, the market appears to have identified a robust support level, indicating a potential rebound from below the equilibrium point.
Taking a wider perspective, the market is in a consolidation phase without clear directional movements. Neither buyers nor sellers seem to hold substantial control. Traders should maintain close vigilance over price movements, particularly for any definitive breakouts above the upper boundary of $0.000900.
What do you think would be in this mystery box?
🚀 We’re unveiling our next new feature this week 🚀
What do you think it will be? Let us know below and we’ll give you some clues 🕵🏻♂️ pic.twitter.com/czOFZcRnNk
— TAMADOGE (@Tamadogecoin) August 29, 2023
Do you want a coin that will be 100 times more valuable in the next few months? That is Tamadoge. Buy TAMA today!