Tamadoge (TAMAUSD) Surges to Elevated Demand Levels on Its Path to Achieving $0.01000
Estimated Reading Time: 3 minutes
Don’t invest unless you’re prepared to lose all the money you invest. This is a high-risk investment and you are unlikely to be protected if something goes wrong. Take 2 minutes to learn more
Since August 19th, the Tamadoge market has upheld the demand level at $0.0076 while a tug-of-war persists, causing the market to trade sideways within a progressively tightening price channel. However, on August 25th, the bullish market surged significantly, reaching the new demand level of $0.00825.
Currently, the market is favorably poised for the continuation of the bullish trend, although it is encountering resistance at the $0.00889 level. If this supply barrier can be breached, the bullish momentum could propel the market towards its target of $0.01000.
Key Levels
- Resistance: $0.015, $0.016, and $0.017.
- Support: $0.0080, $0.0070, and $0.0065.
TAMAUSD Price Analysis: The Indicators’ Point of View
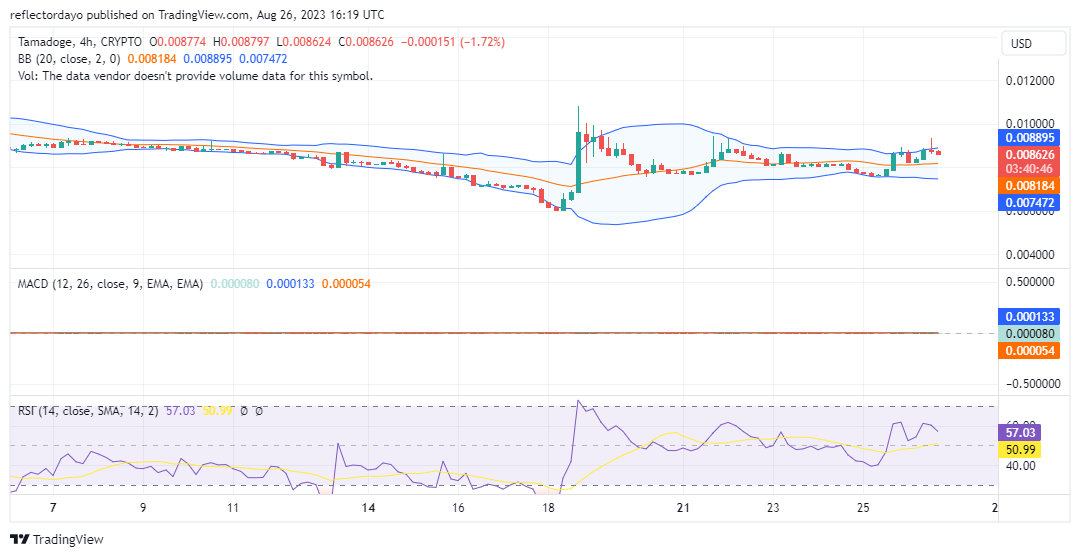
The $0.0082 price level held significant importance within the Tamadoge market’s journey. After retracing from the peak of $0.011 on August 19th, the bulls attempted to establish a solid footing around this point. However, their efforts were hampered by selling pressure, causing the demand level to drop to $0.007559.
The Tamadoge Buyers eventually managed to reclaim the $0.008203 price level, yet they now face a nearby resistance level. Despite all indicators still signaling bullish sentiment, the market seems to be reversing its course after touching the supply level. The Moving Average Convergence and Divergence (MACD) indicator reflects a decline in bullish momentum, with the most recent histogram on the chart showing a faded green hue.
Hopefully, buyers can steer the market upwards beyond the critical demand level, countering pressure at the key resistance point.
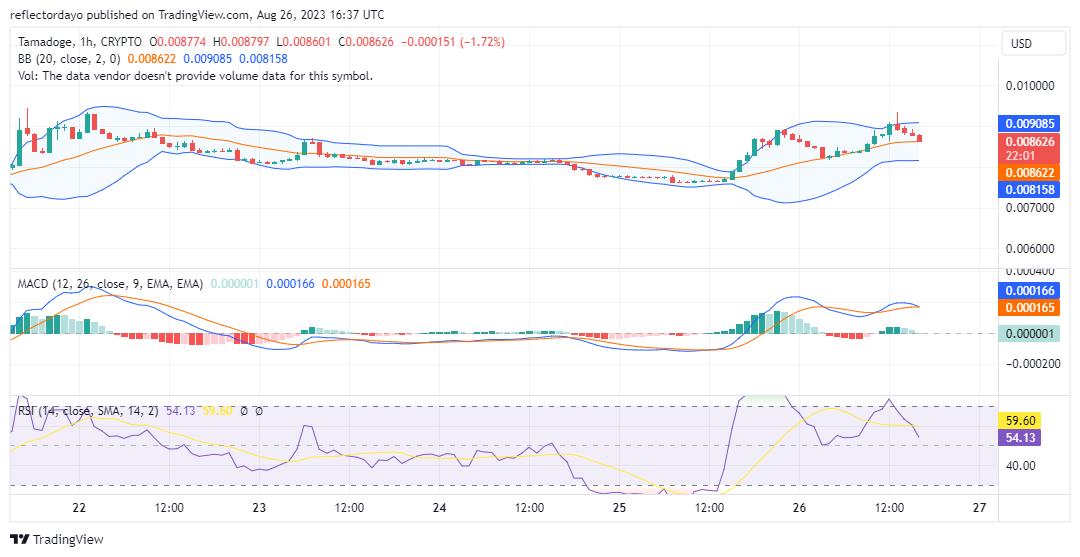
Tamadoge Short-Term Outlook: 1-Hour Chart
Analyzing the 1-hour chart, it’s evident that the Bollinger Bands indicator illustrates an ascending price channel. Additionally, we observe that the price has retraced to the 20-day moving average, positioned at $0.00862. It’s hopeful that the bullish trend will resume from this point, establishing a stronger support level that could exert pressure on the critical resistance threshold.
As for the Moving Average Convergence and Divergence (MACD) indicator, there’s currently a bearish crossover above the zero level. However, the MACD line has not yet fully intersected the signal line. Furthermore, the market remains within the bullish zone of the Relative Strength Index (RSI), potentially granting an advantage to the bulls.
You can earn some $TAMA by playing the game.
Kill some bosses, earn some $TAMA. Easy 🤑
Download Tamadoge Arena on your phone 👇
📱 Android: https://t.co/INCaGendE4
📱 iOS: https://t.co/Fj9tT5Oicu pic.twitter.com/QgfrCIGod3— TAMADOGE (@Tamadogecoin) August 25, 2023
Do you want a coin that will be 100 times more valuable in the next few months? That is Tamadoge. Buy TAMA today!