Cardano (ADA) Is in a Downward Correction, Fluctuating Between $1.40 and $1.80
Estimated Reading Time: 2 minutes
Don’t invest unless you’re prepared to lose all the money you invest. This is a high-risk investment and you are unlikely to be protected if something goes wrong. Take 2 minutes to learn more
Cardano (ADA) Long-Term Analysis: Bearish
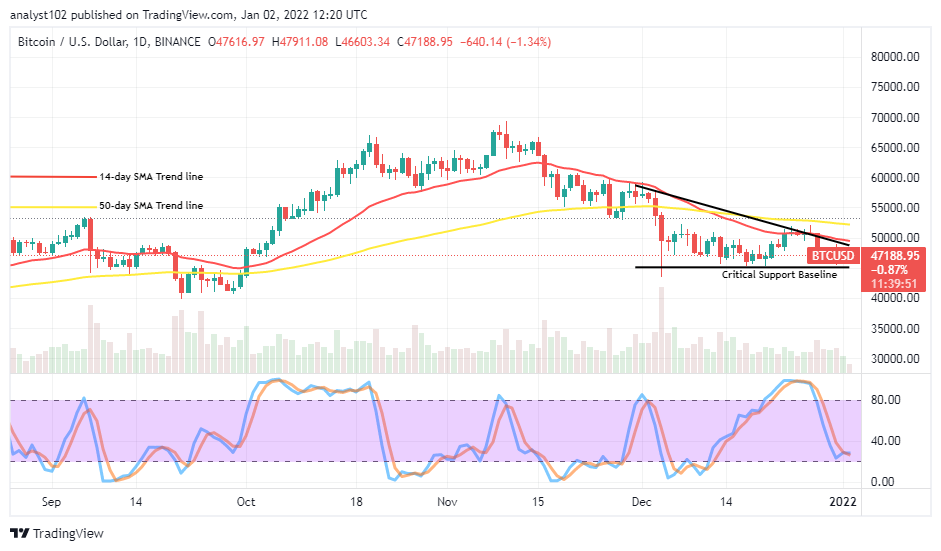
On November 28, Cardano’s (ADA) price is in a downtrend as the price fell to the low of $1.41. The $1.41 low is the previous low of August 8. On November 28, the price corrected upward but was resisted at the `$1.80 high. This rejection may cause ADA to resume selling pressure. In the meantime, ADA/USD is declining to the current support. If the current support holds, the cryptocurrency will be range-bound between $1.40 and $1.80. If the bears break below the $1.40 support, the market will further decline to $1.02 low
Cardano (ADA) Indicator Analysis
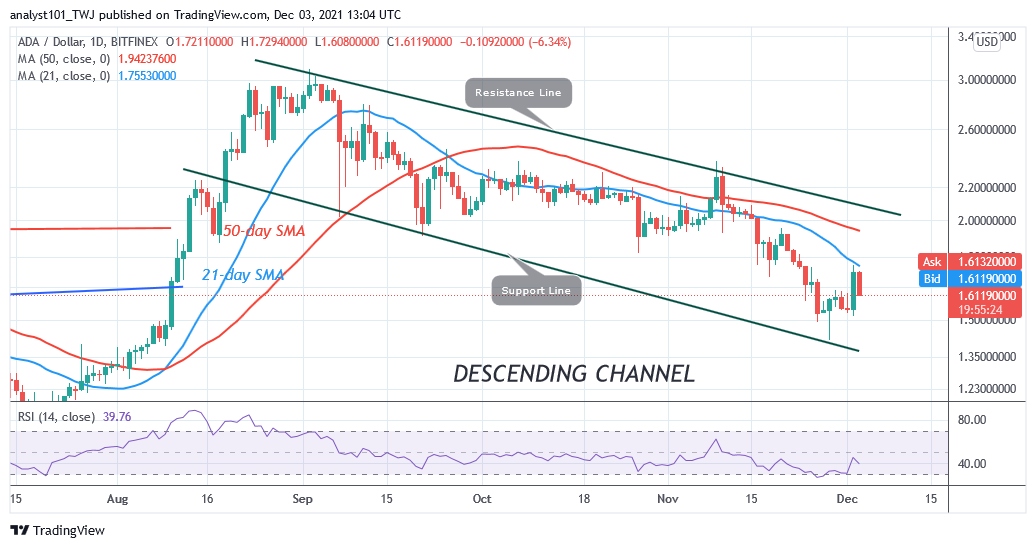
The altcoin is at level 39 of the Relative Strength Index for period 14. The altcoin is in the downtrend zone and below the centerline 50. The crypto’s price is below the moving averages indicating a possible fall of the cryptocurrency. ADA is below the 50% range of daily stochastic. Presently, the market is in a bearish momentum. The 21-day line moving average is acting as resistance to the cryptocurrency. The 21-day SMA and the 50-day SMA are sloping downward indicating the downtrend.
Technical indicators:
Major supply zones: $2.0, $2.20, $2.40
Major demand zones: $1.40, $1.20, $1.00
What Is the Next Direction for Cardano (ADA)?
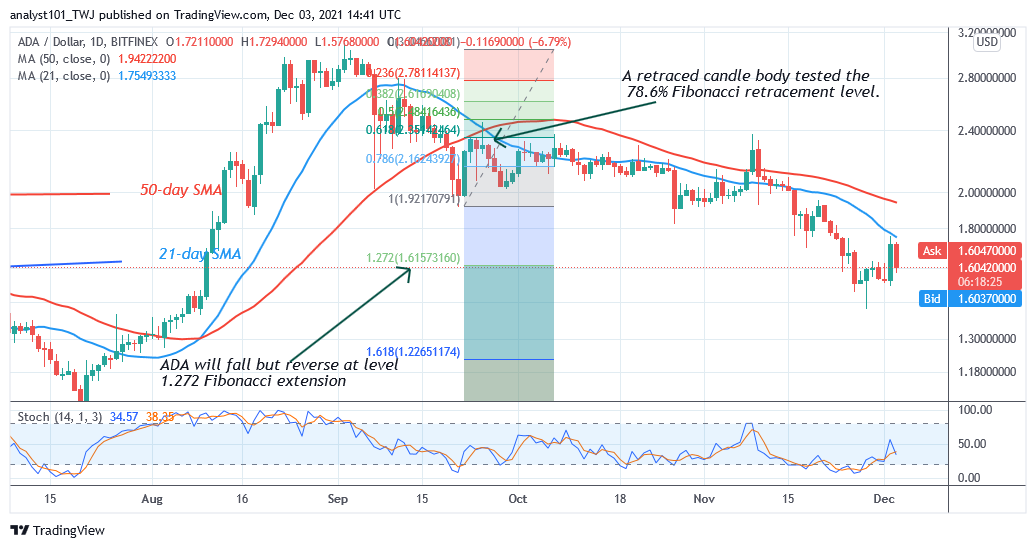
Cardano is still in a downward correction. The downtrend has reached bearish exhaustion as the market reaches the oversold region. Meanwhile, on September 22 downtrend; a retraced candle body tested the 78.6% Fibonacci retracement level. The retracement indicates that Cardano will fall to level 1.272 Fibonacci extension or $1.60. From the price action, Cardano has tested the Fibonacci level but slumped to the low of $1.41 and pulled back.
You can purchase crypto coins here. Buy Token
Note: Cryptosignals.org is not a financial advisor. Do your research before investing your funds in any financial asset or presented product or event. We are not responsible for your investing result