$SPONGE (SPONGE/USD) Set to Soar: Anticipating a Breakout from the $0.000023 Level
Estimated Reading Time: 3 minutes
Don’t invest unless you’re prepared to lose all the money you invest. This is a high-risk investment and you are unlikely to be protected if something goes wrong. Take 2 minutes to learn more

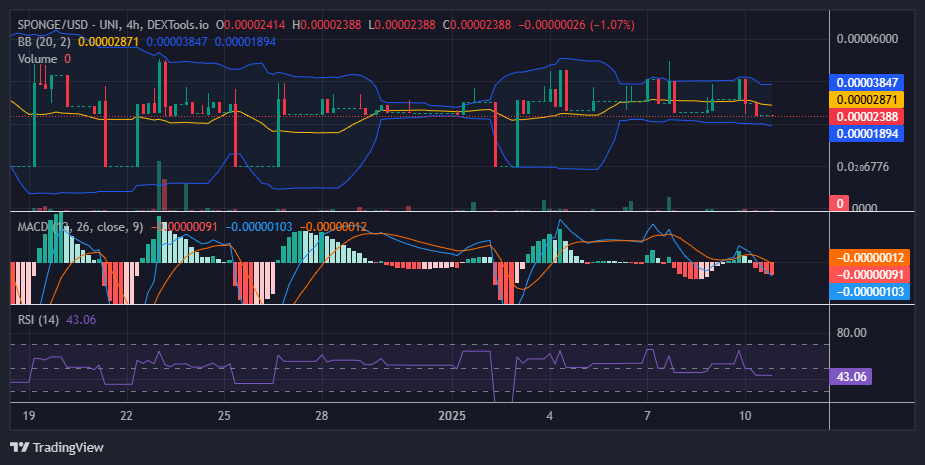
The $SPONGE market has experienced a bearish onslaught over the past few days. The recent tug-of-war between bullish and bearish forces has led to heightened market volatility, resulting in erratic price swings. Despite this volatility, the bears managed to capitalize on the situation, driving the price below the critical support level at $0.000025. This downward momentum has brought the price to approximately $0.000023.
However, the bearish pressure seems to have met strong resistance at the $0.000023 level. Over the past three trading sessions, the market has entered a period of indecision, marked by the appearance of consecutive doji candlesticks. This stalemate suggests that selling momentum may be waning, and a bounce in the $SPONGE market could be on the horizon.
The formation of dojis at this key level signals a potential turning point, offering hope for a recovery as buyers begin to reenter the market. The current setup provides an optimistic outlook for a possible upward move in the near future.
Key Market Dynamics:
- Resistance Levels: $0.00005, $0.000055, $0.000060
- Support Levels: $0.000020, $0.0000195, $0.000019
$SPONGE (SPONGE/USD) Technical Analysis
In today’s $SPONGE market, the price has fallen below the $0.000025 support level, which was identified in the previous analysis as a potential relaunch point. However, due to recent bearish activity, this support level has shifted downward to approximately $0.000023.
At this new support level, the market has entered a phase of indecision, as evidenced by three consecutive doji candlesticks. This pattern typically reflects a standstill in market momentum following a bearish move that drove the price to a lower level. The appearance of these dojis suggests that sellers may be experiencing exhaustion, while buyers are beginning to counterbalance the downward pressure, creating a stalemate at the new support level.
This situation highlights a critical juncture for the crypto signal, where further developments could indicate either a reversal or continuation of the prevailing trend.
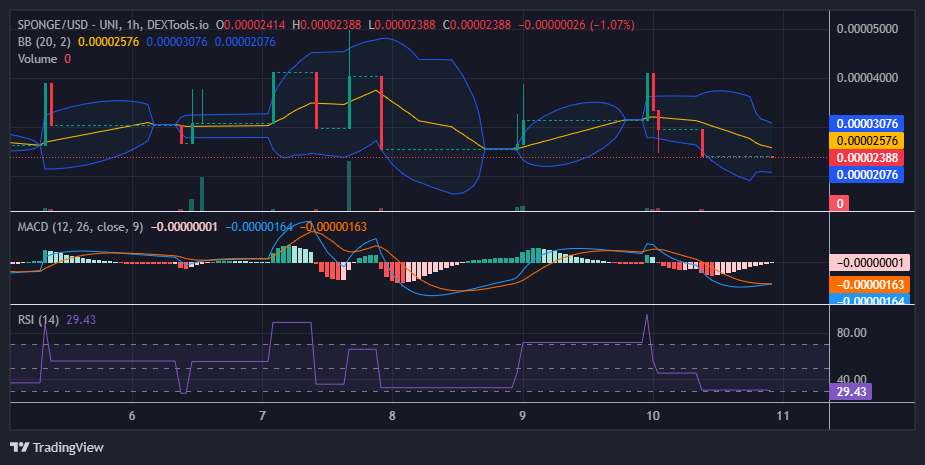
$SPONGE (SPONGE/USD) 1-Hour Chart Observations
Despite the bearish pressure that has driven the market to a lower price level, the price has remained steady at $0.000023, showing resilience. This stability could indicate that the market is gearing up for a potential bounce.
The Moving Average Convergence and Divergence (MACD) indicator supports this outlook. The bearish histograms show a clear and progressive decline in momentum, signaling weakening bearish strength. Additionally, the MACD lines are nearing a bullish crossover, a development that often signals the onset of bullish momentum.
Further supporting this possibility, the Bollinger Bands are gradually converging, indicating reduced volatility and the potential for a significant price move. These combined factors suggest that a rebound may be on the horizon.
Buy SPONGE/USD!
The trenches aren’t for the weak pic.twitter.com/MMJ62WVWWI
— $SPONGE (@spongeoneth) January 8, 2025
Join the SPONGE community and be part of the next big crypto sensation! Buy Sponge ($SPONGE) today!