Bitcoin (BTC/USD) Price Continues Pricing at $17,000
Estimated Reading Time: 3 minutes
Don’t invest unless you’re prepared to lose all the money you invest. This is a high-risk investment and you are unlikely to be protected if something goes wrong. Take 2 minutes to learn more
Bitcoin Price Prediction – January 4
Reactions of buying and selling in the BTC/USD market have remained predominant as the crypto’s price continues pricing around the $17,000 trading spot over time. The ups and downs in the transaction have swung feebly from $16,665.53 to $16,920.72 and $16,648.78 at an average percent of 1.08 positive.
BTC/USD Market
Key Levels:
Resistance levels: $18,000, $19,000, $20,000
Support levels: $16,000, $15,000, $14,000
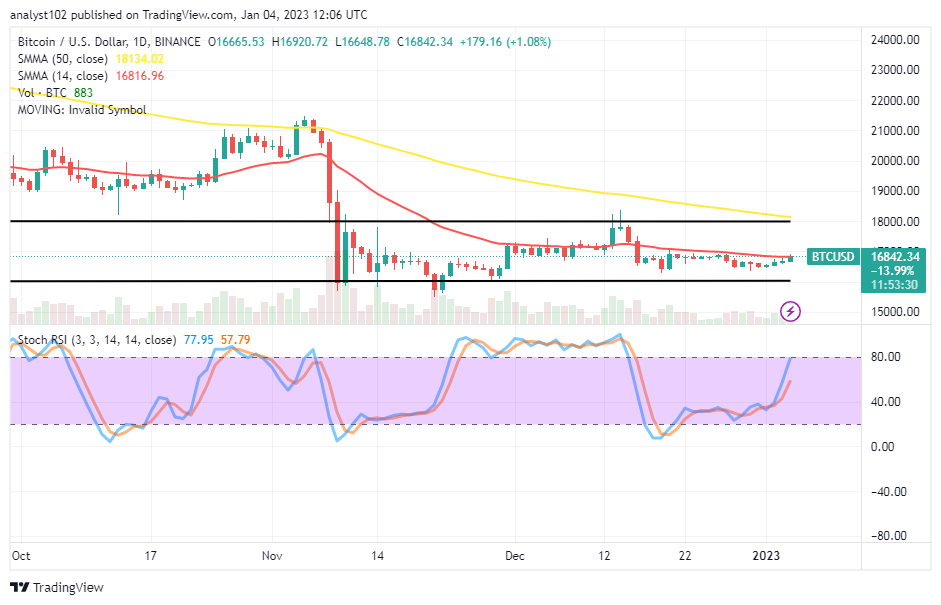
BTC/USD – Daily Chart
The BTC/USD daily chart reveals the crypto-economic price continues to price around the psychological trading at $17,000 over a long time. A string of candlesticks has developed to indicate that some meaningful downward movement has occurred below the point in issue. The 14-day SMA indicator is at a $16,816.96 value, underneath the $18,134.02 of the 50-day SMA indicator. The Stochastic Oscillators have crossed northbound to 57.79 and 77.95 levels. The 50-day SMA indicator’s value is $18,134.02, while the 14-day SMA indicator is at a value of $16,816.96. The stochastic oscillators have crossed levels 57.79 and 77.95 in the northward direction.
What are the presently obtainable reactions in the BTC/USD market operations?
As of writing, buying activities seem to be prevailing slightly over selling habits in the BTC/USD market operations as the price continues pricing around the $17,000 level. A current surging movement suggests that buyers are in control of the market. Nevertheless, the situation doesn’t produce a decent entry to join the ride. Therefore, that means long-position placers will have to be cautious of launching new longing orders.
On the depreciation-moving side of the BTC/USD market technical analysis, there has been a continual rallying motion that needs to await a reversal characterized by a bearish candlestick before placing a sell order. A northward push against the trend value point of the 14-day SMA at $16,816.96 will allow sellers to stage a sell limit order around the resistance of $18,000. To prevent whipsawed trading, bears will need to prepare for the prospect of a slow and steady market rally.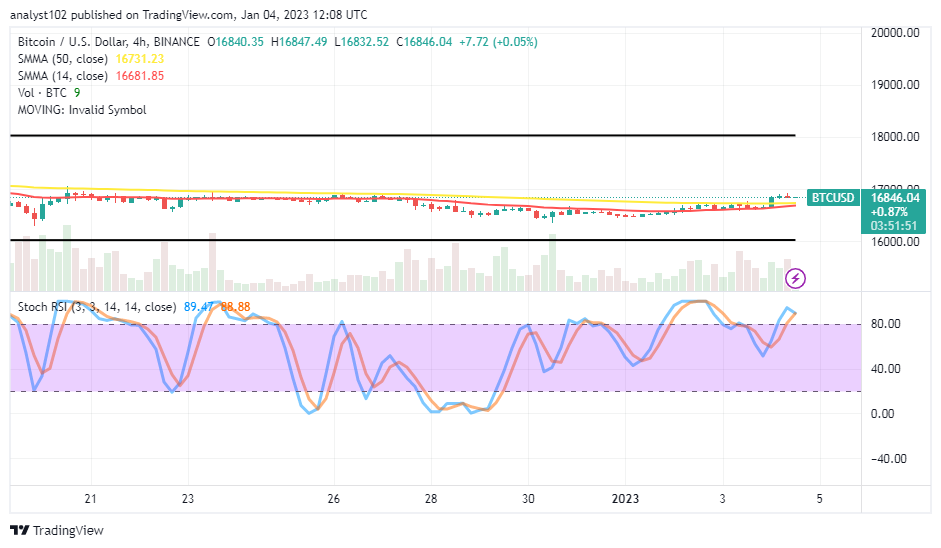
BTC/USD 4-hour Chart
The BTC/USD medium-term chart showcases the price continues pricing around the $17,000 level over a couple of sessions in the well-defined range-bound zones of $18,000 and $16,000 as marked by the upper and the lower horizontal lines. The 14-day SMA trend line is at $16,681.85, closely beneath the $16,731.23 point of the 50-day SMA trend line. The Stochastic Oscillators are in the overbought region, keeping 89.41 and 88.88 levels to signal that a pause may feature soon in the trading style.
Note: Cryptosignals.org is not a financial advisor. Do your research before investing your funds in any financial asset or presented product or event. We are not responsible for your investing results.
You can purchase Lucky Block here. Buy LBLOCK


