The Sei Market (SEI/USD) Aims to Secure and Sustain Momentum at the $0.50 Level
Estimated Reading Time: 3 minutes
Don’t invest unless you’re prepared to lose all the money you invest. This is a high-risk investment and you are unlikely to be protected if something goes wrong. Take 2 minutes to learn more

Starting from the $0.20 price threshold, the Sei market has battled through significant resistance within the lower price zones, reaching the critical $0.50 level. At this point, bearish traders have established a strong resistance, rejecting multiple bullish attempts to break out. Since late September, price action has been consistently testing this level. However, during the trading sessions of both yesterday and today, notable bullish momentum has emerged, with the price currently holding slightly above the $0.50 mark. Let us now delve into the analysis of the key indicators.
Sei Market Data
- SEI/USD Price Now: $0.514
- SEI/USD Market Cap: $2.15 billion
- SEI/USD Circulating Supply: 4.25 billion
- SEI/USD Total Supply: 10 billion
- SEI/USD CoinMarketCap Ranking: #49
Key Levels
- Resistance: $0.55, $0.60, and $065
- Support: $0.45, $0.40, and $0.35.
The Sei Market Through the Lens of Indicators
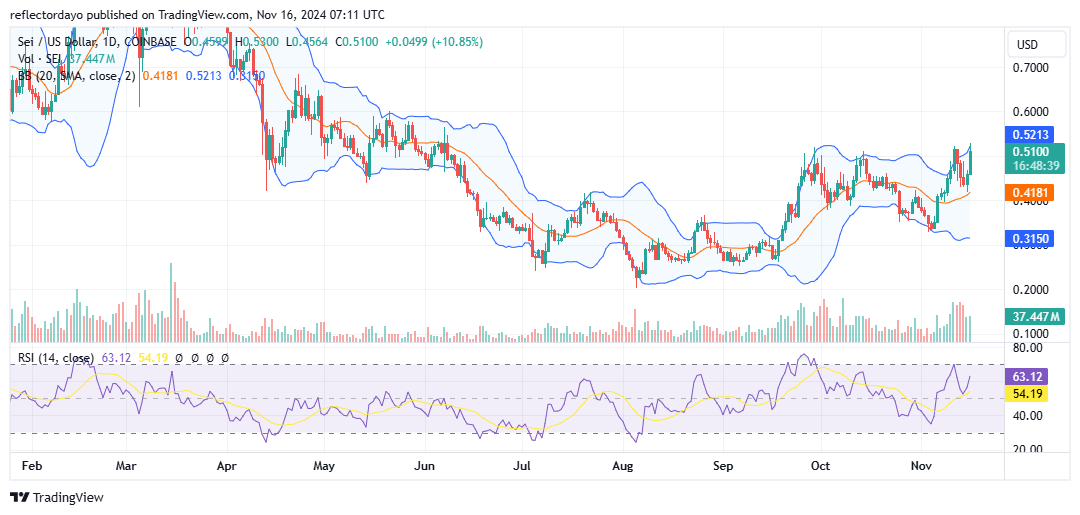
Analyzing the market through the lens of key indicators, the Sei market is attempting to navigate its bullish trajectory through challenging conditions. While the bulls currently maintain a slight advantage, the price action is approaching a critical resistance level at $0.50, making it increasingly difficult for them to sustain a breakout.
Recent volume histogram data reveals heightened investor interest in the market, contributing to erratic price movements that, for now, favor the bulls. However, the narrowing bandwidth of the Bollinger Bands suggests that bullish dominance remains tenuous. Although the crypto signal is slightly above the $0.50 level, it is still under significant bearish influence.
This precarious balance of power means it is too early to declare a definitive victory for the bulls. The market’s volatility indicates that erratic oscillations may continue until the price decisively breaks upward toward the $0.60 mark.
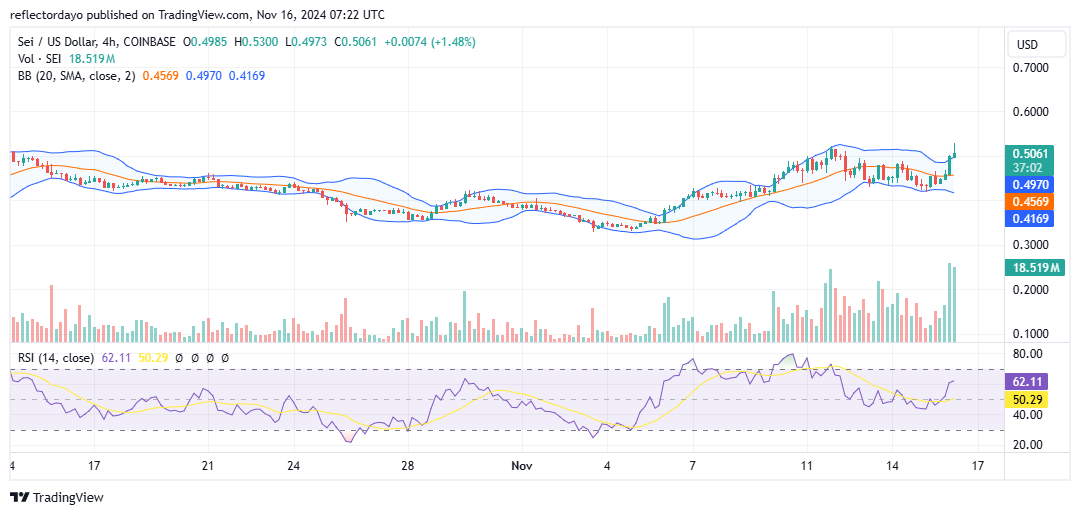
SEI/USD Price Prediction: 4-Hour Chart Analysis
Examining the 4-hour chart, we identify a support level at $0.44, accompanied by the appearance of a shooting star candlestick and significant trade volume, as indicated by substantial histograms. The combination of this candlestick pattern and high trading volume suggests the potential onset of either a market correction or the development of a bearish trend.
However, it is plausible that during any correction, the $0.44 support level could once again serve as a key point of rebound, potentially providing a foundation for renewed bullish momentum.