Bitcoin (BTC/USD) Market Dominates the Features at $17,000
Estimated Reading Time: 3 minutes
Don’t invest unless you’re prepared to lose all the money you invest. This is a high-risk investment and you are unlikely to be protected if something goes wrong. Take 2 minutes to learn more
Bitcoin Price Prediction – December 28
There has been a concurrence of buying and selling activities in the BTC/USD price operation as the crypto market dominates the features around the $17,000 level over a couple of several sessions. The condition signifies low-active ups and downs between $16,749.02 and $16,560.18, maintaining a minute negative percentage rate of 0.39.
BTC/USD Market
Key Levels:
Resistance levels: $18,000, $19,000, $20,000
Support levels: $16,000, $15,000, $14,000
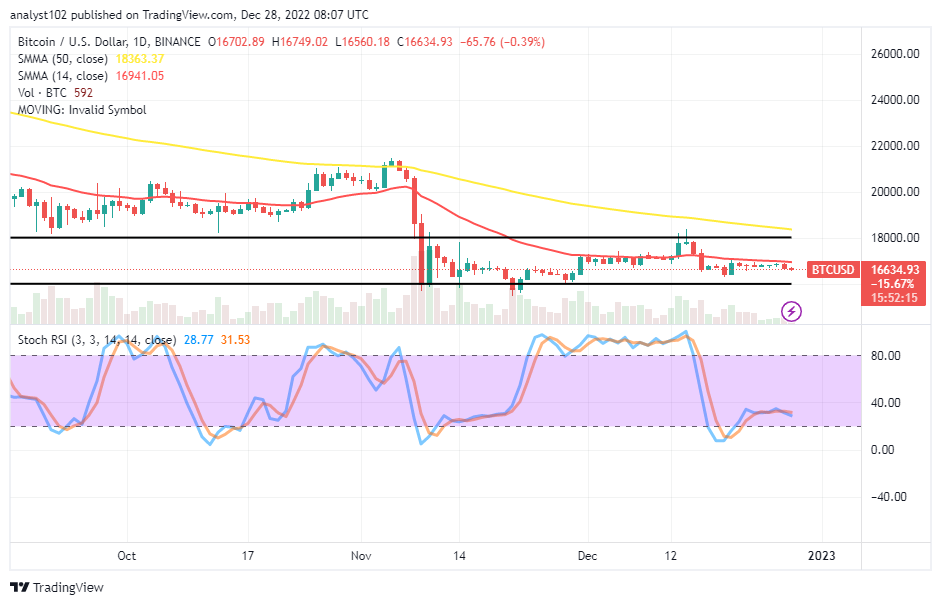
BTC/USD – Daily Chart
The daily chart showcases that the BTC/USD market dominates the features around the $17,000 level, running into some days. Variant trading candlesticks that have formed carry a slight declining mode than giving promissory upside pushes. The 14-day SMA indicator is at $16,941.05, underneath the $18,363.37 value line of the 50-day SMA indicator. The Stochastic Oscillators have clogged between 40 and 20 range points. And they are slightly bending southbound at 31.53 and 28.77 levels to denote that a falling mode is in progress.
Will the characteristics of the BTC/USD market’s activities remain the same, around $17,000?
From the technical reading of the Stochastic Oscillators at the moment, it portends that there will be a continuity in the BTC/USD trade happenings as the crypto market dominates the features around the $17,000 line for quite some days, running into weeks. In the long run, in pursuance of the current low-active pushes to the downside, bulls will likely find support around the $16,000 level most of the time under the current sell-off settings.
On the depreciation-moving side of the BTC/USD market, our believe s that sellers will still not relieve their forces below the 50-day SMA indicator’s value point in the near session. Intending short-position placers who wish to launch a position at all costs can do so when an active move to the south side is spotted. However, a line of sustainable rallying motions can summarily decimate an early stage to getting a decent sell entry order.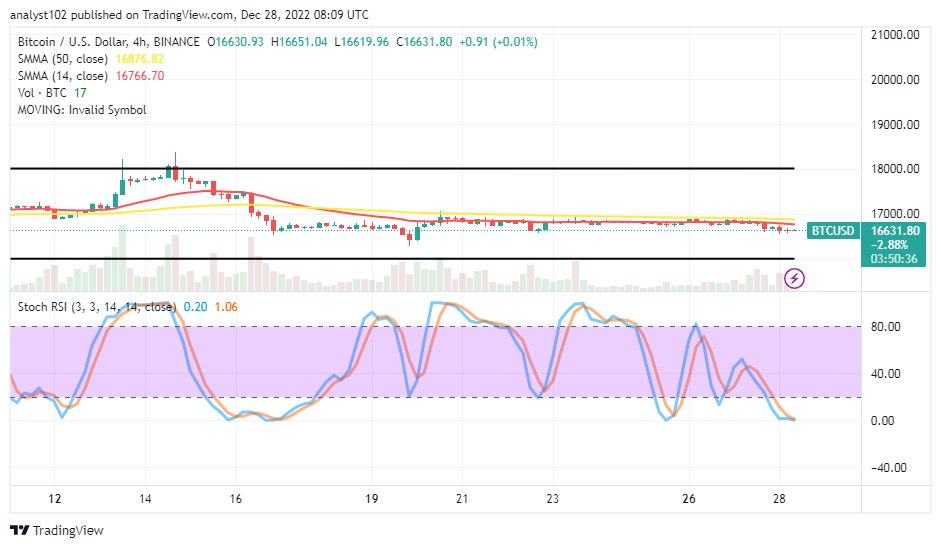
BTC/USD 4-hour Chart
The BTC/USD medium-term chart depicts the crypto market dominating the features around the $17,000 trading line within well-defined range-bound zones marked up and down at $18,000 and 416,000 levels. The 14-day SMA trend line is at $16,766.70, closely underneath the $16,876.82 value line of the 50-day SMA indicator. And they both trend eastward to ascertain the pace of the sideways-moving outlook in the market. The Stochastic Oscillators have dipped into the oversold region, trying to close at 0.20 and 1.60 levels to denote that a pause may soon play out.
Note: Cryptosignals.org is not a financial advisor. Do your research before investing your funds in any financial asset or presented product or event. We are not responsible for your investing results.
You can purchase Lucky Block here. Buy LBLOCK