Bitcoin (BTC/USD) Trade Is Moving Nearly at $17,000
Estimated Reading Time: 3 minutes
Don’t invest unless you’re prepared to lose all the money you invest. This is a high-risk investment and you are unlikely to be protected if something goes wrong. Take 2 minutes to learn more
Bitcoin Price Prediction – December 21
The BTC/USD market operations yesterday saw a string of rises against the backdrop of the previous dropping position toward the $16,000 support line as the crypto trade is moving nearly $17,000 points. There is a minute negative percentage rate of 0.25, showing that the price trades around the $16,860.21 value line as of writing.
BTC/USD Market
Key Levels:
Resistance levels: $18,000, $19,000, $20,000
Support levels: $16,000, $15,000, $14,000
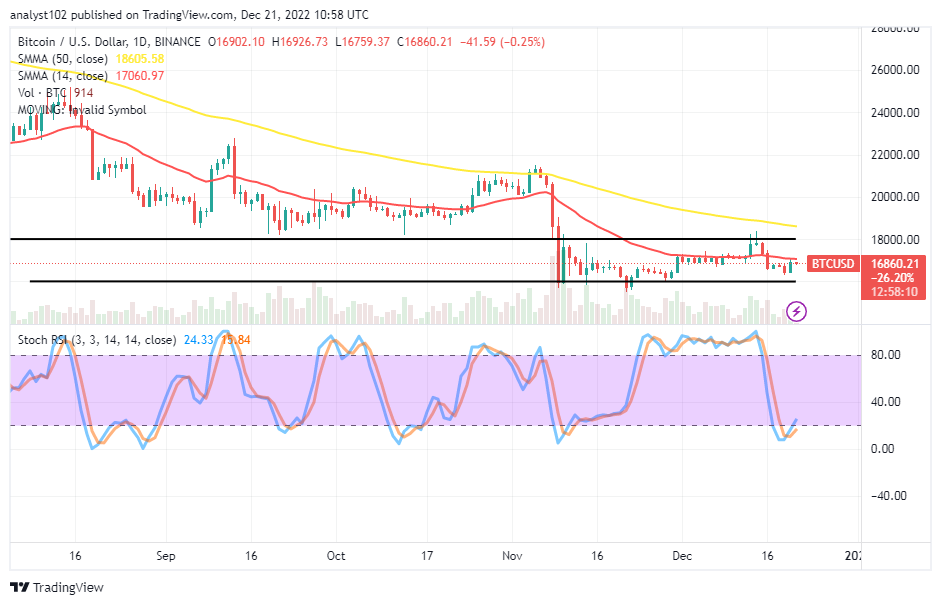
BTC/USD – Daily Chart
The BTC/USD daily chart reveals that the crypto-economic trade is moving nearly $17,000 around the smaller SMA’s current position. The 50-day SMA indicator is at an $18,605.58 value line over the 14-day SMA indicator, which is at a $17,060.97 point. The Stochastic Oscillators have dipped into the oversold region, trying to cross their lines back to the northbound at 15.84 and 24.33 levels. The horizontal lines established at the upper and lower values of $18,000 and $16,000 are still crucial in determining a clear course.
Will the BTC/USD market appreciate further than the value line of the smaller SMA?
Going by the size of yesterday’s bullish trading candlestick wall in the BTC/USD market, a further increase can surface past the value point of the smaller SMA’s trend line as the crypto trade is moving nearly $17,000 in well-defined rangebound spots of $18,000 and $16,000. The current rate of motion indicates that the price has reached a completion lower zone, where bulls frequently take positions in anticipation of upswings later in the session.
On the depreciation-moving side of the BTC/USD market’s technical analysis, the market bears look to lack the power to push southward beyond the $16,000 support trading level in the near time. As for the time being, the price has every tendency index to resume a rallying motion from its current trading capacity toward the upper range point at the $18,000 resistance level in the long-term run.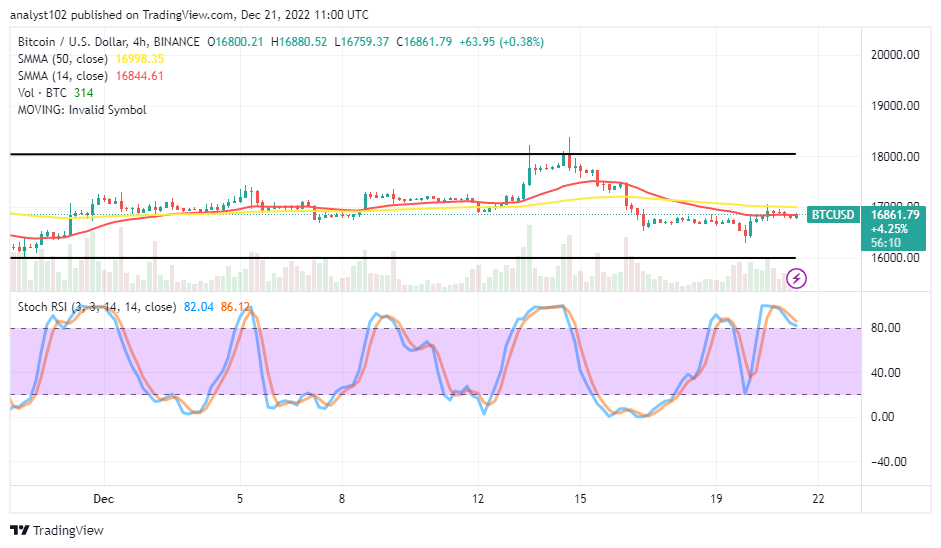
BTC/USD 4-hour Chart
The BTC/USD medium-term chart mirrors the crypto trade is moving nearly the $17,000 level, closely below the value line of the bigger SMA. The 14-day SMA indicator is at $16,844.61 beneath the $16,998.35 value line of the 50-day SMA indicator. A small southbound-mode cross between the Stochastic oscillator’s lines at levels 86.12 and 82.04 indicates that a relative drop is currently predominating in the trading environment.
Note: Cryptosignals.org is not a financial advisor. Do your research before investing your funds in any financial asset or presented product or event. We are not responsible for your investing results.
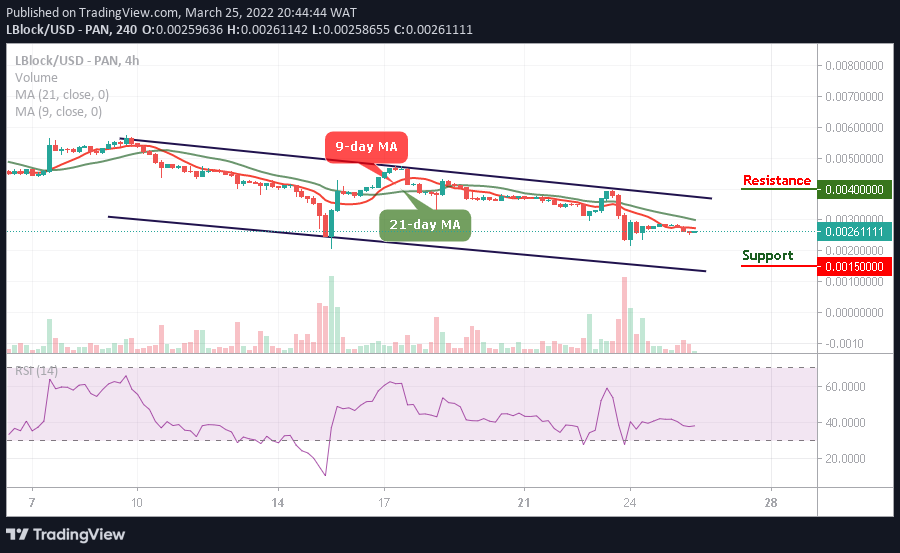
You can purchase Lucky Block here. Buy LBLOCK