Tamadoge (TAMA/USD) Market Update: Bulls Hold the Line at the $0.0008 Support
Estimated Reading Time: 3 minutes
Don’t invest unless you’re prepared to lose all the money you invest. This is a high-risk investment and you are unlikely to be protected if something goes wrong. Take 2 minutes to learn more
The TAMA/USD market continues to consolidate as bulls defend the key $0.00008 support zone following a recent dip in price action. Although the market experienced a brief downside break in the latest trading sessions, sellers were unable to drive momentum further, and the price quickly approached the $0.00008 threshold.
At present, bullish players are working to stabilize the price around this critical support level, resisting the increasing bearish pressure. Maintaining control at $0.00008 remains essential for sustaining the broader bullish bias that has been evident in recent sessions.
If buyers successfully hold this level and regain upward momentum, the market may attempt another breakout, with a potential surge above the $0.0001 resistance zone.
Key Levels to Watch
- Resistance: $0.00020, $0.00030, $0.00040
- Support: $0.000080, $0.000075, $0.000070
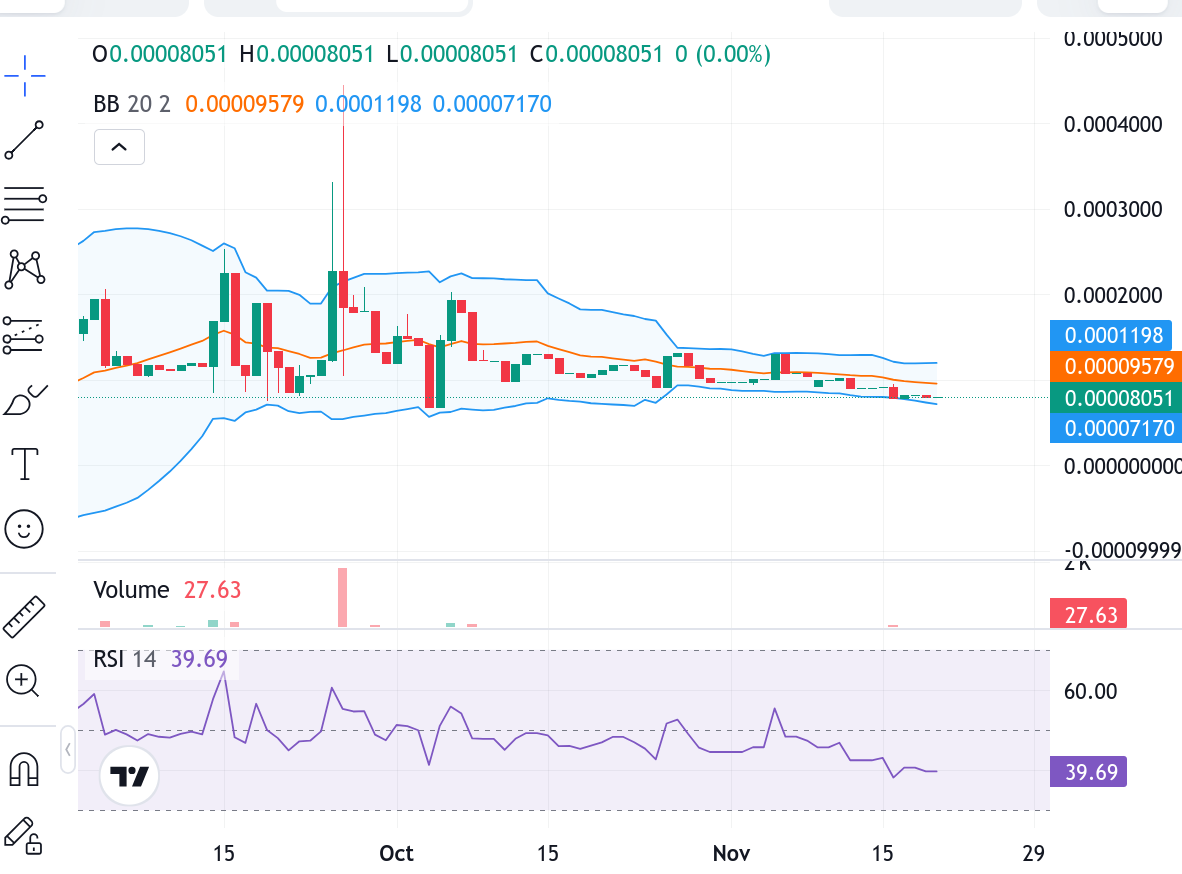
Tamadoge (TAMA/USD) Daily Chart Outlook
From the broader daily chart perspective, TAMA/USD continues to display a strong consolidation pattern despite recent bearish activity. Although sellers have pushed the price lower, the downward momentum does not appear sufficient to drive a sustained decline. The series of doji candlesticks forming on the four-hour chart reinforces the likelihood of bearish exhaustion.
A decisive breakdown below the $0.00008 support level could still pave the way for a deeper drop toward the $0.00007 zone. However, based on the current crypto signal structure, such an extended decline appears less probable, as the strongest bearish impulse has emerged only in the latest trading session.
Price behavior in the coming sessions will be pivotal in determining the market’s next directional bias, as traders watch for either a confirmed rebound or a continuation of downward pressure.
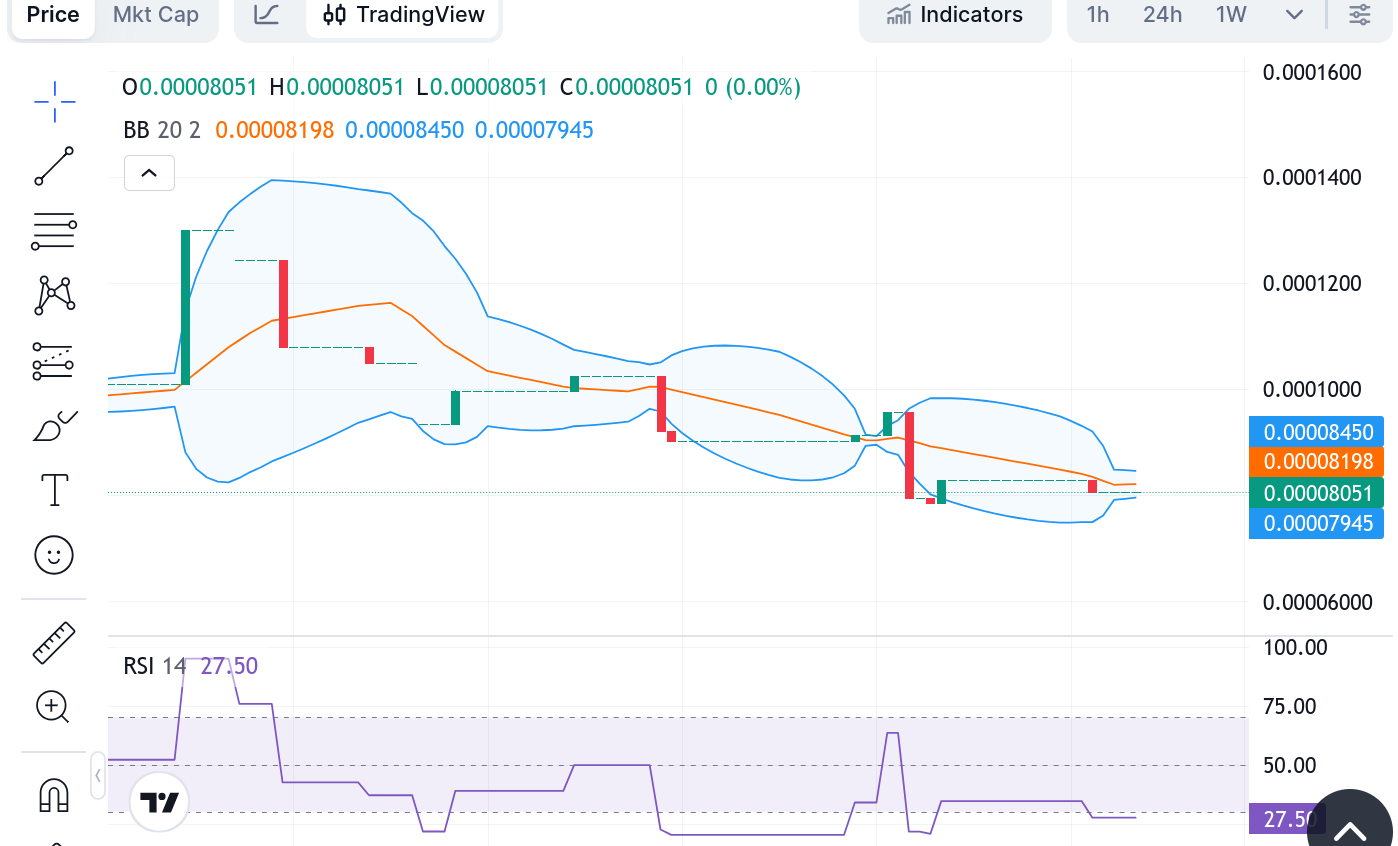
TAMA/USD Short-Term Outlook (4-Hour Chart)
On the lower time frame, the emergence of four consecutive doji candles following a downward price move suggests weakening bearish momentum. This pattern typically signals potential seller exhaustion.
Additionally, the RSI remains below the 30 mark—currently around 27—indicating that the market has entered oversold territory.
With momentum significantly stretched to the downside, conditions now favor the possibility of a rebound. This increases the likelihood of a short-term price recovery as buyers may begin to re-enter the market.
Buy Tamadoge!
There’s no mobile runner out there quite like #TamadogePursuit! 🏃♂️
1️⃣ Sign up – start with 20 free credits for a boost!
2️⃣ Climb up the leaderboards.
3️⃣ Win $TAMA rewards!Play Now! 👇
📱Android: https://t.co/Of8SYALRzL
📱 iOS: https://t.co/IthvqovwAH pic.twitter.com/84HNqob9Rf— TAMADOGE (@Tamadogecoin) September 10, 2024