Chainlink (LINK/USDT) Hints at a Potential Bounce
Estimated Reading Time: 3 minutes
Don’t invest unless you’re prepared to lose all the money you invest. This is a high-risk investment and you are unlikely to be protected if something goes wrong. Take 2 minutes to learn more

Chainlink Long-term Analysis: Bearish
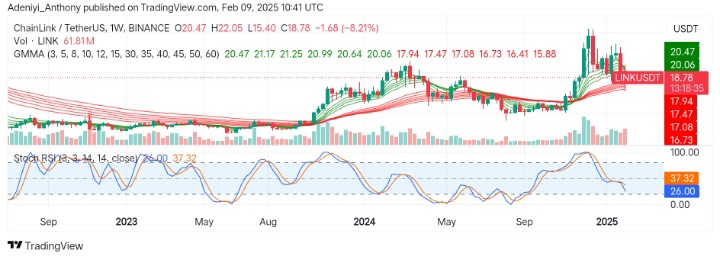
Chainlink against the Tether on the weekly timeframe has seen a significant drop after hitting above $20.47 in previous trades. The price seems to be breaking important support levels as it operates at the $18.00 level.
Recently, Chainlink enjoyed a bullish rally with the formation of several bullish candlesticks. However, the price has been trending downward with the formation of lower lows, as the pair trades around the longer-period EMAs of the Guppy Multiple Moving Averages (GMMAs). This signals more downside in the near term. However, the appearance of the Stochastic oscillator beneath the chart suggests the pair may be preparing for a bounce as the lines head toward a critical level.
Currently, Chainlink is trading at $18.78, 8.21% below the opening price, and recording over 61 million traded volumes for the week.
Technical Indicators
Major Resistance Levels: $22.05, $26.50, and $30.00
Major Support Levels: $17.50, $15.40, and $13.50
Chainlink Technical Analysis
The weekly analysis of the Chainlink against the stablecoin, Tether, shows the pair has been on a downtrend after failing to break above a previous high at the beginning of the year. However, the price activities and the convergence of the GMMAs show the pair is preparing for a bearish crossover as the price moves closer to the $17.00 level.
On the other hand, the Stochastic RSI signals a near oversold condition for the pair as the lines read 37.32 for orange and 26.00 for blue. This signals more bearish participation in the market with the blue extending further into the oversold region.
To this end, the pair may experience a further dip if the price breaks below the $17.50 level. However, recovery may be expected if the price holds above the $18.50 level.
LINK/USDT Analysis: Expectation
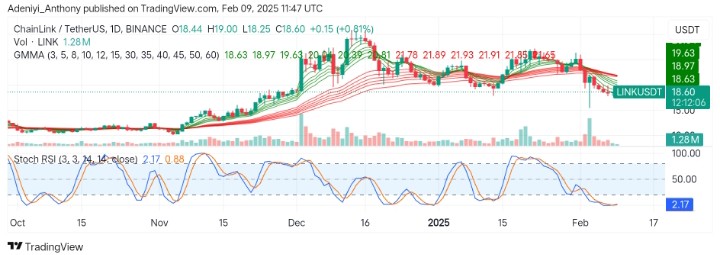
On the daily timeframe, LINK/USDT has witnessed a strong dip in previous sessions as the GMMAs show signs of extended bearish dominance. However, the price seems to be hovering around the last EMAs, signaling a potential bounce might be on the horizon.
Additionally, the Stochastic oscillator beneath the chart is also beginning to indicate a promising move to the north as the lines hint at a bullish momentum.
To this end, the price needs to break above $19.00 with the lines leaving the oversold territory before a significant bullish move can be recorded; otherwise, a break below the current level would signal a continuation of the downtrend.
You can purchase crypto coins here. Buy LBlock