UMA (UMAUSD) Encounters a Shortcoming in Its Uptrend Movement
Estimated Reading Time: 3 minutes
Don’t invest unless you’re prepared to lose all the money you invest. This is a high-risk investment and you are unlikely to be protected if something goes wrong. Take 2 minutes to learn more
Market Analysis – UMA Breaks Out of Ascending Channel After It Encounters Shortcoming at $14.70
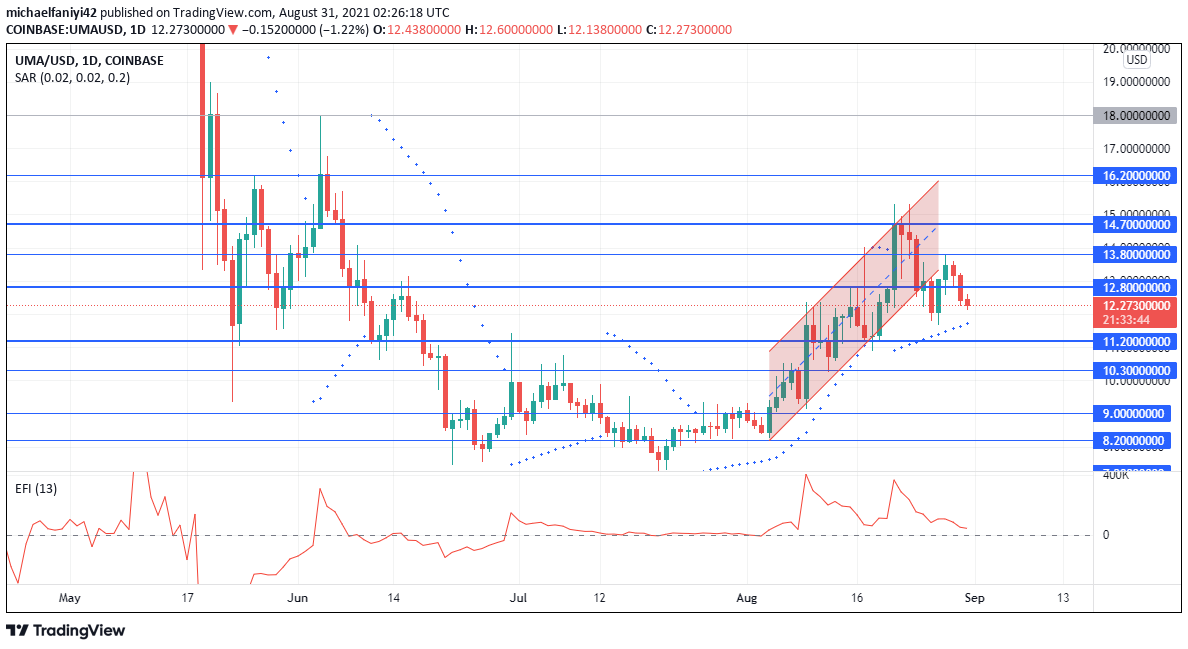
UMA encounters a shortcoming at the $14.70 resistance level, which has now changed the market’s direction. The coin has been conduction itself upwards utilizing an ascending parallel channel. The upward movement started from the $8.20 price level on the 4th of August 2021. By 17 days later, the coin had ascended past all the barriers to reaching $14.70. At this point, UMA received a heavy knock which redirected the market.
UMA Key Levels
Resistance Levels: $12.80, $13.80, $14.70
Support Levels: $11.20, $10.30, $8.20
The market can be seen taking major leaps at certain key levels along the ascending channel. After price encounters $10.30 and failed to break it, it pulled back to $9.00 where the coin leaped from there above $11.20. A short period of consolidation followed between $12.80 and $11.20, from where price broke up with another major leap that shot the price to $14.70.
At the $14.70 resistance level, the coin was met with resistance, which knocked it out of the ascending channel and back below $12.80. From there, bulls have been struggling to make further upthrust. The latest attempt saw UMA rejected at $13.80. The EFI (Elders Force Index) has its force line remain in the positive half despite the shortcoming the UMA encounters. This means bulls still have momentum and will try more upside moves.

Market Anticipation
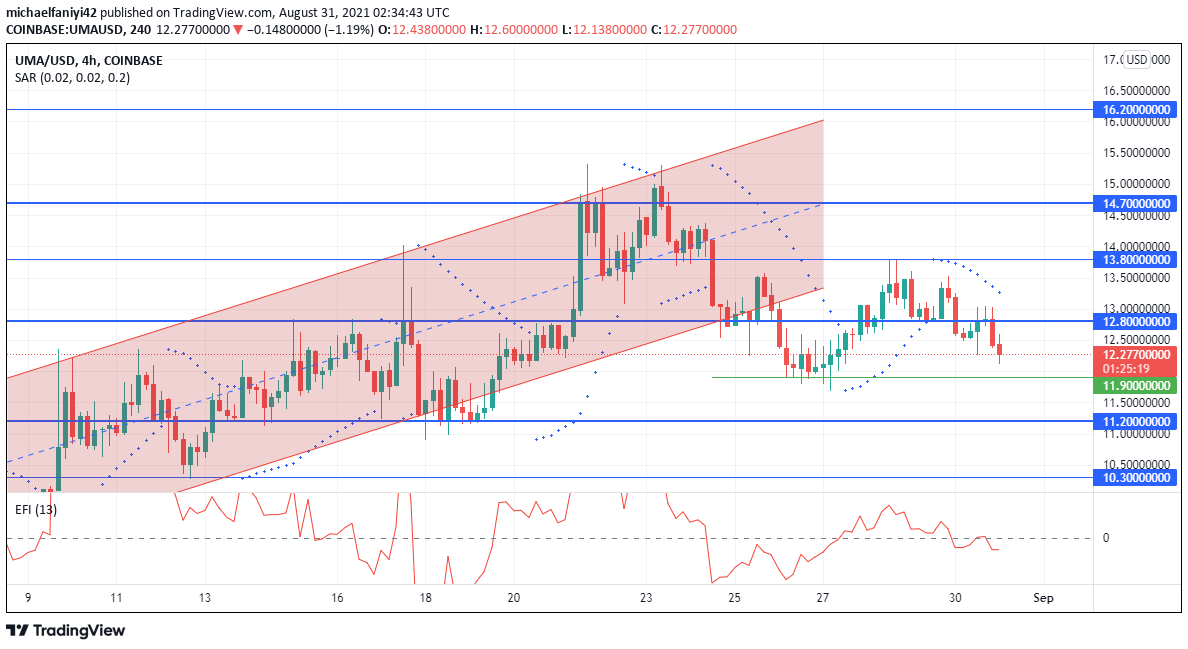
After breaking out of the ascending parallel channel, the market seems to be moving in a ranging pattern with the $13.80 key level as resistance and $11.90 as support. The Parabolic Stop and Reverse, however, judge the market as bearish by aligning several dots above the 4-hour candles. The EFI means while has its force line undulating in and out of the negative region. Essentially, this shows market equilibrium in which neither bulls nor bears have the upper hand. However, it is expected that for the market to ascend to test $14.70 again, the price might first drop to $11.20.
You can purchase crypto coins here: Buy Tokens
Note: Cryptosignal.org is not a financial advisor. Do your research before investing your funds in any financial asset or presented product or event. We are not responsible for your investing results.