Lucky Block Tests Support in Healthy Market Pullback
Estimated Reading Time: 3 minutes
Don’t invest unless you’re prepared to lose all the money you invest. This is a high-risk investment and you are unlikely to be protected if something goes wrong. Take 2 minutes to learn more

Lucky Block is experiencing a controlled retracement of -2.91%, a move that represents a natural and healthy test of support following its recent significant advances. This pullback allows the market to consolidate its gains and build a stronger foundation for the next leg of the uptrend, with the overall bullish structure remaining firmly intact.
Daily Chart Analysis: Bullish Framework Holds Strong
The daily chart confirms that the broader bullish framework remains in place despite the short-term pullback. The Parabolic SAR indicator continues to provide a bullish signal, with its dots positioned significantly below the current price at approximately 0.00001050, indicating that the primary trend direction remains upward. The MACD, while showing some convergence, continues to trade in positive territory, suggesting the underlying momeentum is merely cooling rather than reversing.
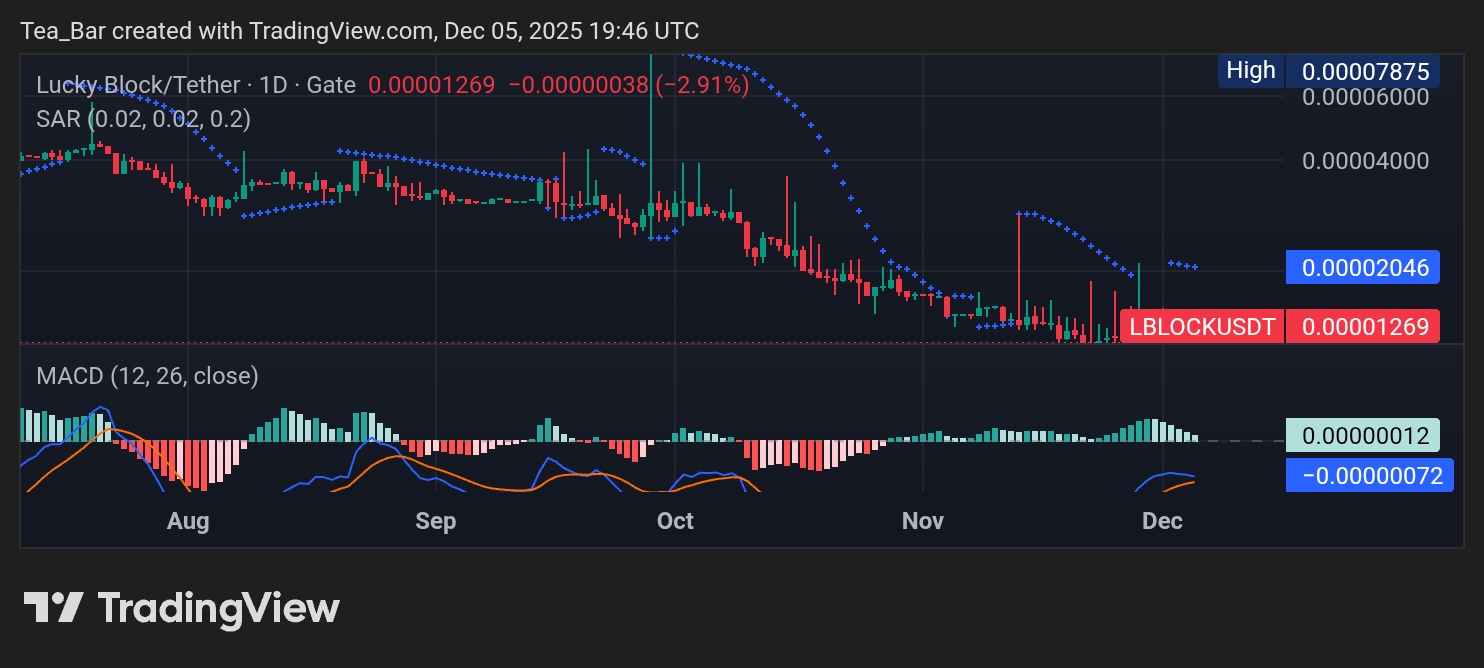
Key resistance levels to monitor on the next advance are 0.00002046, 0.00002846, and 0.00004000. On the support side, the current price at 0.00001269 is the first critical level to hold, followed by the Parabolic SAR near 0.00001050 and the psychological level of 0.00000900.
4H Chart Analysis: Short-Term Consolidation Offers Opportunity
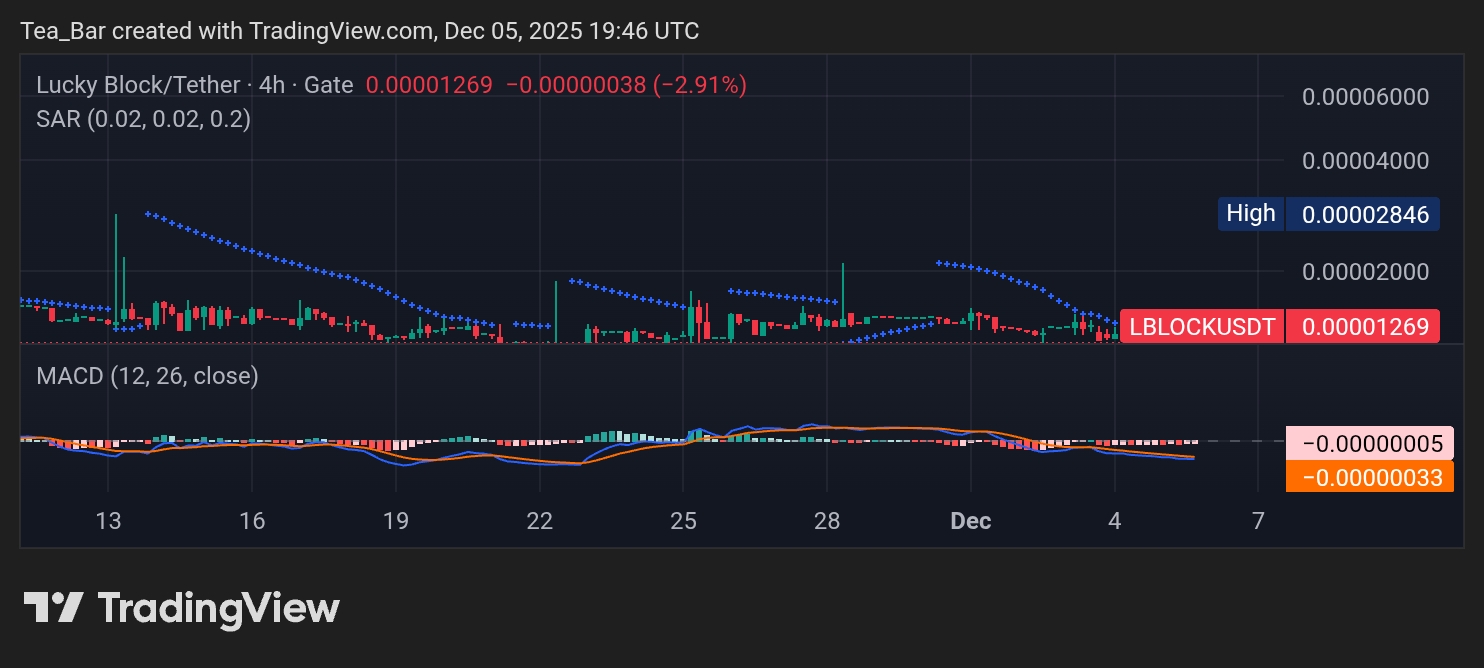
The 4-hour chart reveals this decline as a routine test of support within an established uptrend. The Parabolic SAR remains in a bullish configuration, providing a dynamic support level that the price is now approaching. The MACD histogram has dipped slightly into negative territory, indicating a short-term pause in buying pressure, which is typical during a consolidation phase and often precedes the next momentum surge.
Immediate resistance on this timeframe is found at 0.00002000, with higher targets at 0.00002846 and 0.00004000. The pullback is testing support at 0.00001269, with stronger floors expected near 0.00001100 and 0.00000950
Conclusion: Strategic Pause Before Next Advance
Lucky Block is undergoing a standard and constructive market pullback, which serves to reset momentum indicators and solidify support levels. The essential bullish components, led by the Parabolic SAR’s positioning, remain unchanged. This period of consolidation offers a potential strategic entry point for anticipating the resumption of the primary uptrend toward the next set of resistance targets.
Invest wisely, and let Lucky Block’s potential work in your favor. You can purchase Lucky Block here. Buy LBLOCK.