Lucky Block Unleashes Another 10% Surge as Bullish Momentum Accelerates
Estimated Reading Time: 3 minutes
Don’t invest unless you’re prepared to lose all the money you invest. This is a high-risk investment and you are unlikely to be protected if something goes wrong. Take 2 minutes to learn more

Lucky Block continues its impressive upward trajectory with another powerful surge exceeding 10%, demonstrating sustained bullish momentum and strong buyer conviction. This latest advance confirms the strength of the recent breakout and positions LBLOCK for further gains as technical indicators align favorably across timeframes.
Daily Chart Analysis: Bullish Trend Gains Strength
The daily chart showcases a robust bullish trend that continues to gather momentum. The Parabolic SAR indicator remains firmly in bullish configuration with dots positioned below the price action, providing consistent confirmation of the ongoing uptrend. The MACD indicator displays strong positive momentum with the histogram firmly in positive territory and both the MACD line and signal line trending higher, indicating sustained buying pressure.
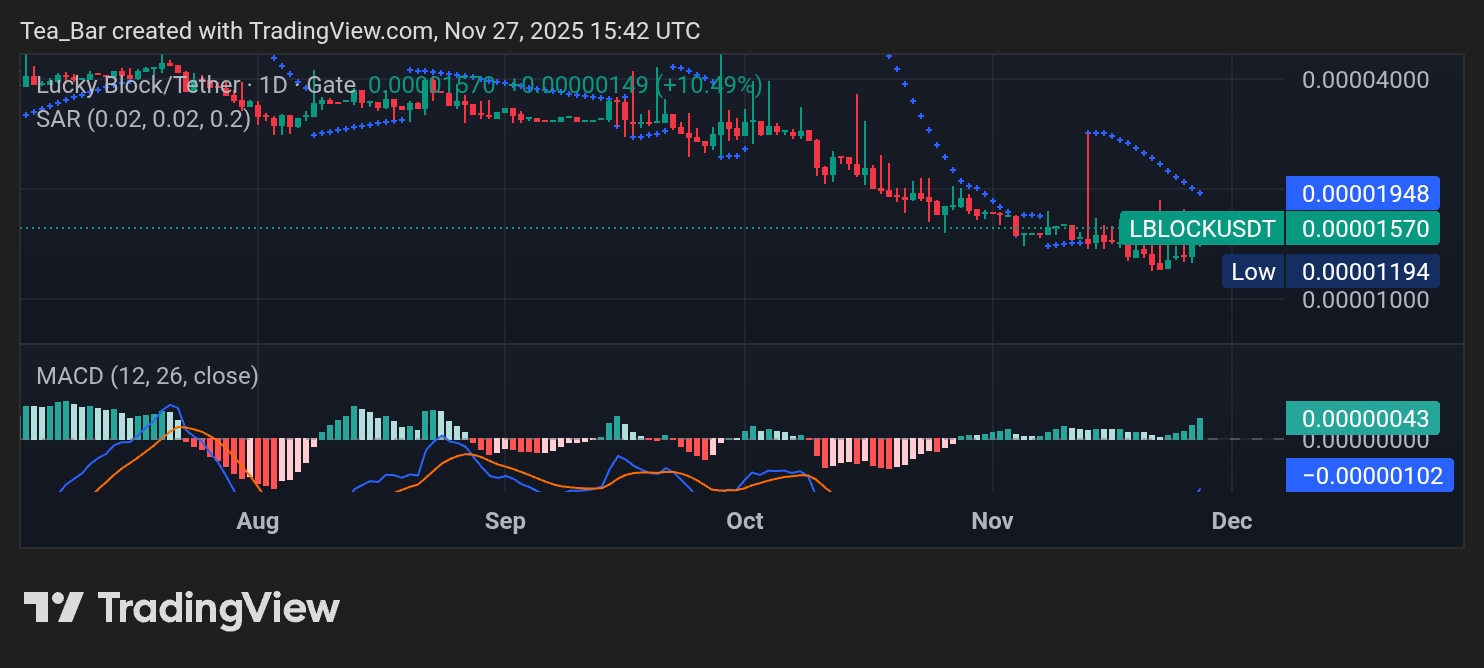
Key resistance levels to monitor are 0.00001948, 0.00002846, and 0.00004000. These represent the next logical targets for the advancing bullish momentum. On the support side, 0.00001570 now serves as immediate foundation, backed by stronger levels at 0.00001194 and the significant psychological barrier at 0.00001000.
4H Chart Analysis: Sustained Buying Pressure Evident
The 4-hour chart reveals continuous buying interest with the price action maintaining its upward trajectory. The Parabolic SAR maintains its bullish alignment, providing ongoing buy signals as each new candle forms. The MACD indicator on this timeframe shows a healthy bullish configuration with the histogram remaining positive and both lines trending upward, reflecting sustained momentum without signs of exhaustion.
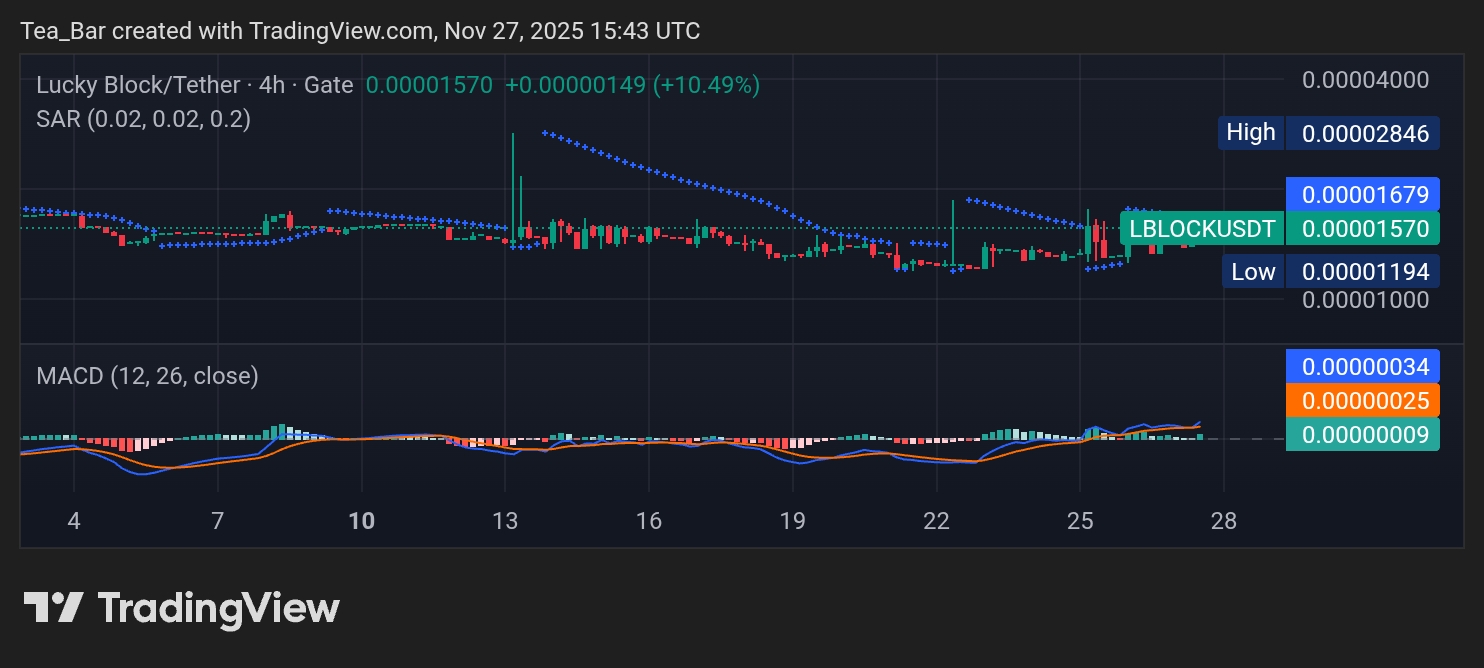
Immediate resistance is encountered at 0.00001679, with subsequent targets at 0.00002846 and 0.00004000. The bullish structure finds reliable support at 0.00001570, with additional safety nets at 0.00001194 and 0.00001000, creating a well-defined trading range with clear risk parameters for market participants.
Conclusion: Strong Uptrend Intact with Further Upside Potential
Lucky Block maintains its powerful bullish momentum with consecutive significant gains that validate the strength of the current uptrend. The technical landscape, supported by the Parabolic SAR’s unwavering bullish signals and the MACD’s strong positive readings, creates an environment conducive to further appreciation. With clearly defined support zones providing downside protection and established resistance targets offering upward potential, LBLOCK presents a compelling opportunity for continued bullish movement in the coming sessions as the asset seeks to challenge higher resistance levels.
Invest wisely, and let Lucky Block’s potential work in your favor. You can purchase Lucky Block here. Buy LBLOCK.