Lucky Block Surges 12% as Technical Breakout Gains Momentum
Estimated Reading Time: 3 minutes
Don’t invest unless you’re prepared to lose all the money you invest. This is a high-risk investment and you are unlikely to be protected if something goes wrong. Take 2 minutes to learn more

Lucky Block is demonstrating explosive momentum with massive gains exceeding 11% across timeframes, signaling a powerful technical breakout from recent consolidation patterns. This substantial price movement reflects accelerating buyer interest and suggests the beginning of a significant trend reversal that could propel LBLOCK to substantially higher levels.
Daily Chart Analysis: Major Trend Reversal Underway
The daily chart reveals a decisive bullish breakout as LBLOCK surges 12.47% to establish new near-term highs. The Parabolic SAR indicator has completed a dramatic trend reversal, with dots now positioned below the price action, confirming the transition from a downtrend to a new bullish phase. The MACD indicator shows strong upward momentum with the histogram turning positive, supporting the case for continued upward movement.
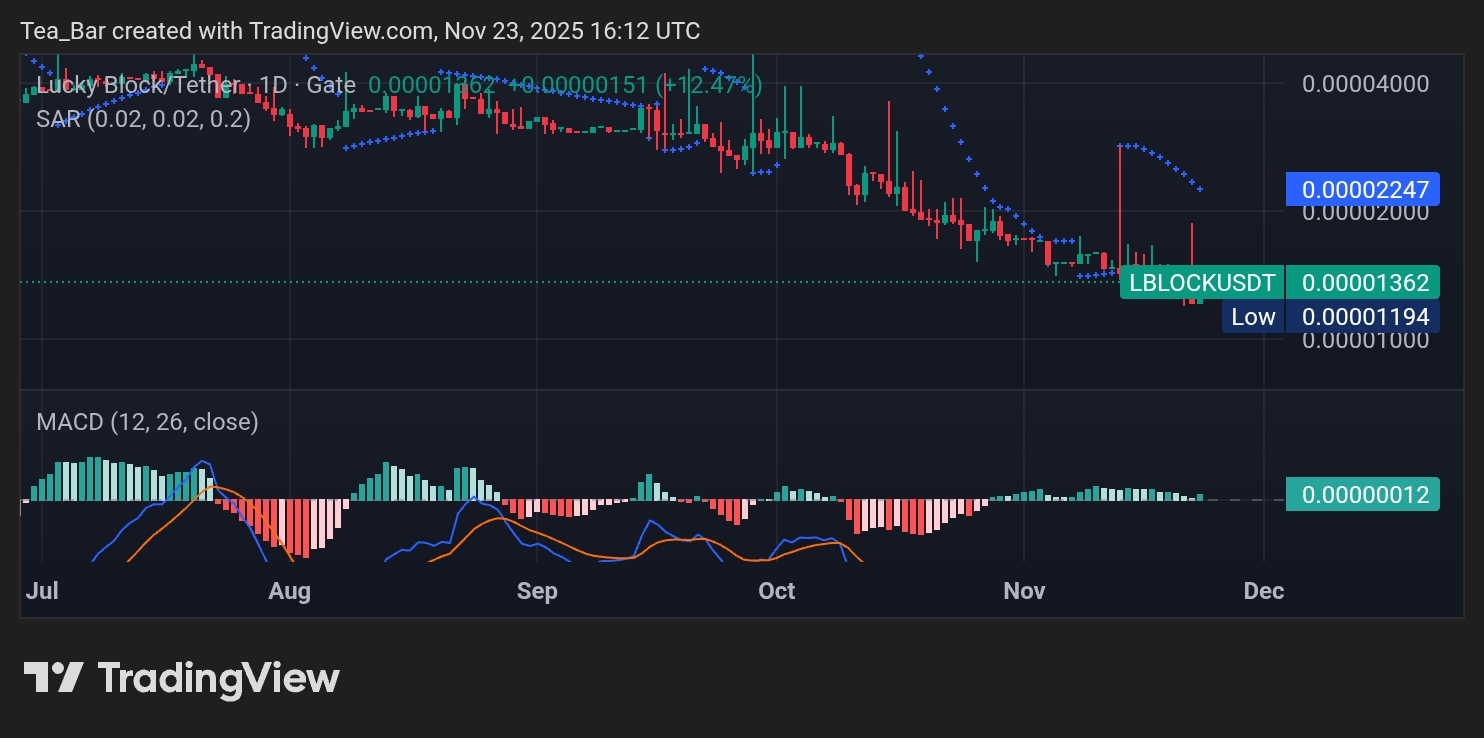
Critical resistance levels to watch are 0.00001738, 0.00002247, and 0.00002846. These represent the next targets for the bullish momentum. On the support side, 0.00001356 now serves as immediate foundation, with stronger floors at 0.00001194 and the psychological 0.00001000 level providing substantial downside protection.
4H Chart Analysis: Explosive Momentum Confirmed
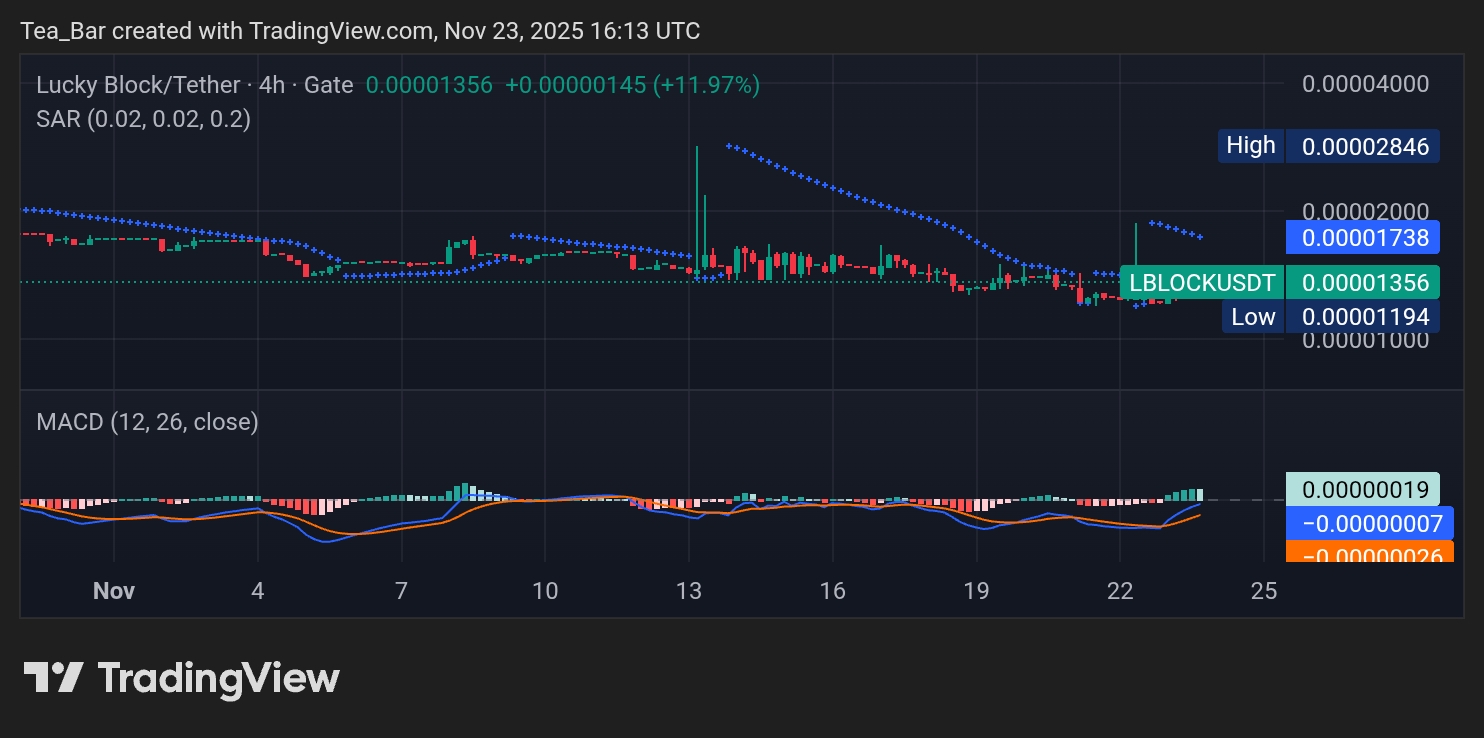
The 4-hour chart showcases the intensity of the bullish breakout with an 11.97% surge that has broken through multiple resistance levels. The Parabolic SAR maintains its bullish configuration, providing consistent buy signals as the uptrend accelerates. The MACD indicator on this timeframe shows a strong bullish crossover with the histogram firmly in positive territory, indicating sustained buying pressure.
Immediate resistance is encountered at 0.00001738, with subsequent targets at 0.00002000 and 0.00002846. The bullish structure finds solid support at 0.00001356, backed by stronger zones at 0.00001194 and 0.00001000, creating a well-defined risk framework for traders entering this emerging uptrend.
Conclusion: Powerful Bullish Breakout
Establishes New Uptrend
Lucky Block has executed a decisive technical breakout with tremendous momentum that confirms a major trend reversal. The combination of double-digit percentage gains, Parabolic SAR trend confirmation, and strengthening MACD momentum creates an exceptionally bullish technical picture. With clear support levels providing protection and defined resistance targets overhead, LBLOCK presents a compelling opportunity for continued upward movement as the new bullish trend establishes its foundation.
Invest wisely, and let Lucky Block’s potential work in your favor. You can purchase Lucky Block here. Buy LBLOCK.