Lucky Block Primed for Bullish Breakout as Key Resistance Levels Tested
Estimated Reading Time: 3 minutes
Don’t invest unless you’re prepared to lose all the money you invest. This is a high-risk investment and you are unlikely to be protected if something goes wrong. Take 2 minutes to learn more

Lucky Block is showing signs of a potential trend reversal as it registers gains exceeding 3.50% across timeframes. The current price action suggests that the asset is attempting to establish a foundation after a prolonged downtrend, with key technical indicators beginning to hint at shifting momentum in favor of the bulls.
Daily Chart Analysis: Foundation Building at Current Levels
The daily chart reveals that LBLOCK is attempting to carve out a potential bottom near the 0.00001479 level. The Parabolic SAR indicator shows dots positioned above the price action, typically indicating a downtrend, but the recent bullish candle and momentum push suggest potential pressure on this resistance. The MACD indicator, while still in negative territory, shows convergence that often precedes bullish momentum shifts.
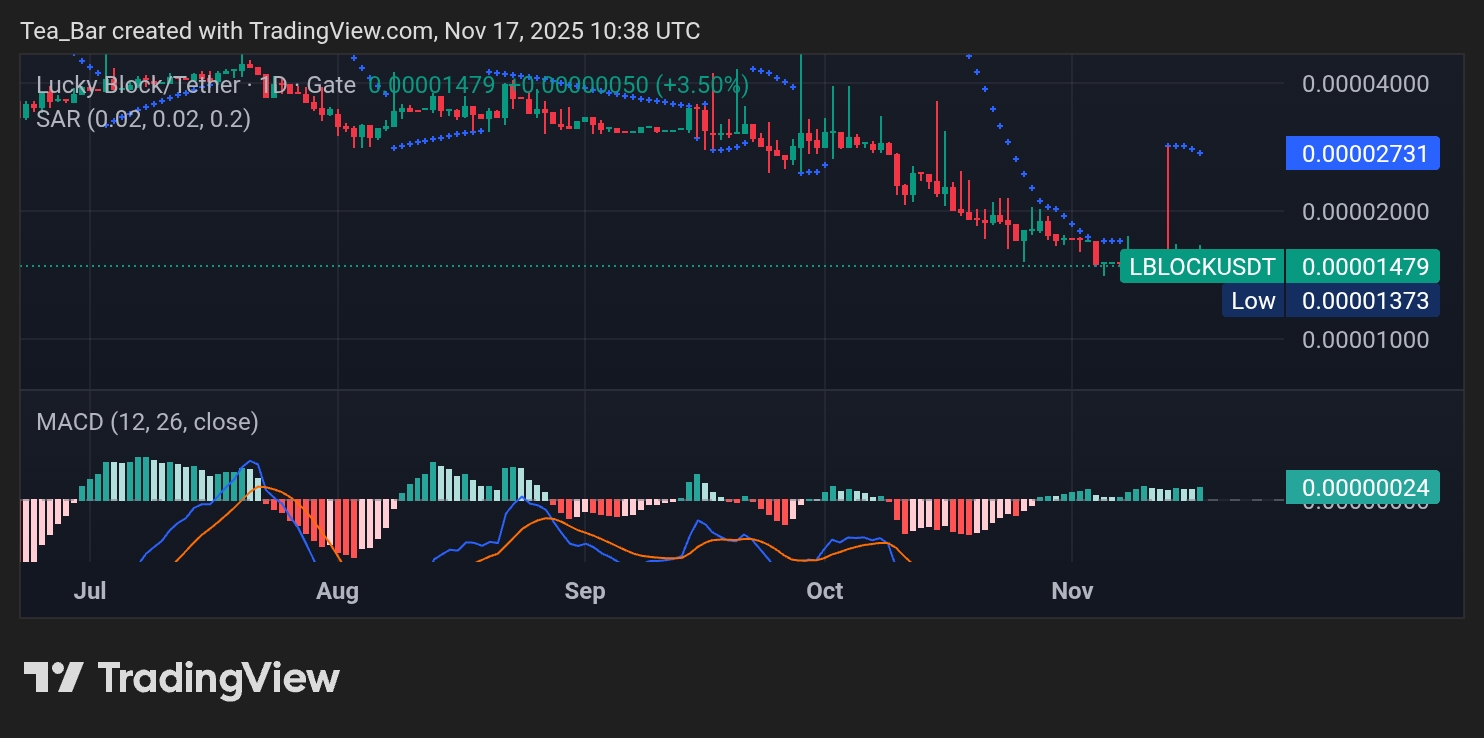
Significant resistance levels to overcome are 0.00001773, 0.00002011, and 0.00002446. These represent key milestones for any sustained recovery. On the support side, 0.00001483 provides immediate foundation, with stronger floors at 0.00001373 and the psychological 0.00001000 level offering substantial downside protection.
4H Chart Analysis: Short-Term Momentum Turns Positive
The 4-hour chart presents a more encouraging technical picture with the Parabolic SAR showing early signs of potential trend reversal as buying pressure increases. The MACD indicator on this timeframe demonstrates improving momentum characteristics, with the histogram showing reduced selling pressure and potential for a bullish crossover in the near term.
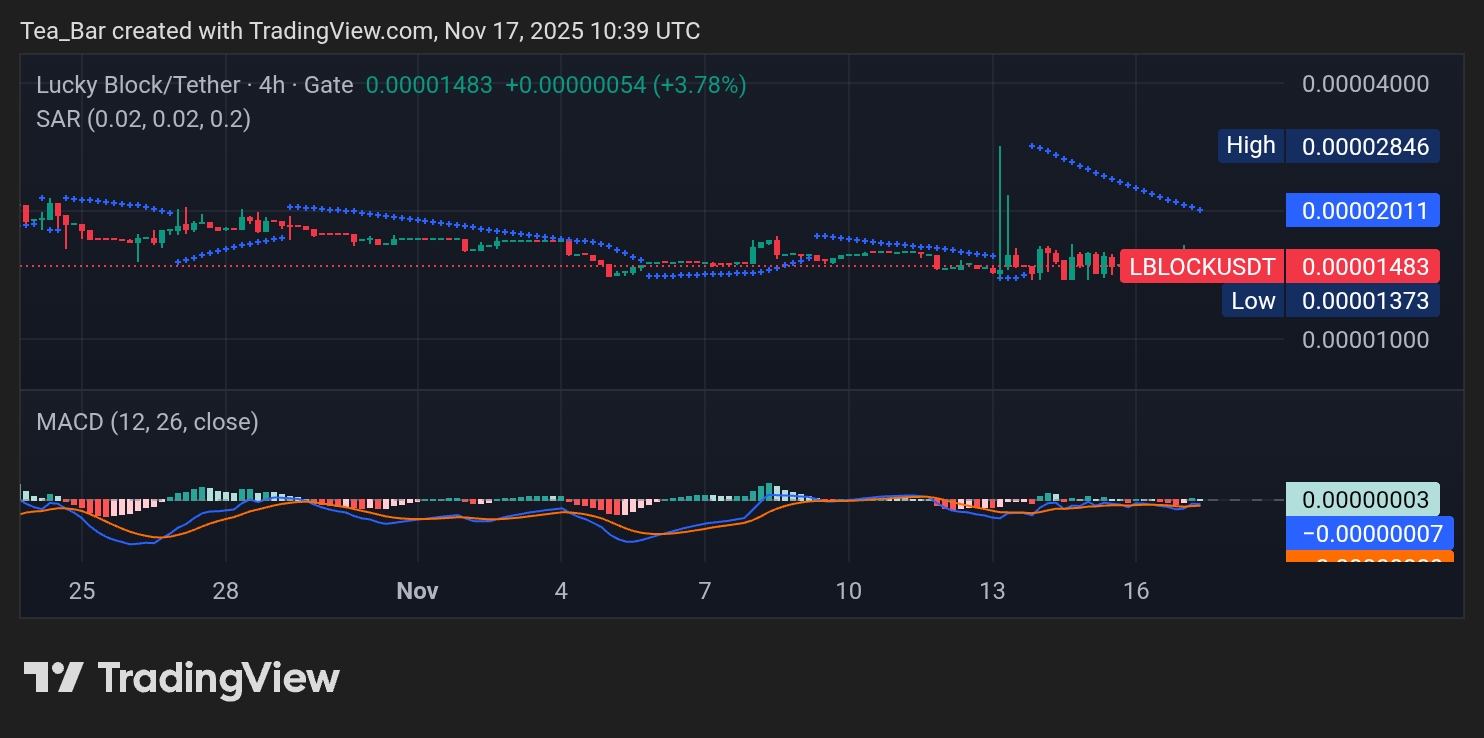
Immediate resistance is encountered at 0.00001773, with subsequent targets at 0.00002011 and 0.00002446. The current structure finds support at 0.00001483, backed by stronger zones at 0.00001373 and 0.00001000, creating a well-defined trading range with clear risk parameters.
Conclusion: Early Reversal Signs Warrant Close Monitoring
Lucky Block is demonstrating initial technical indications of a potential trend reversal, supported by improving momentum readings and successful defense of key support levels. While the broader trend requires further confirmation, the current setup presents an interesting opportunity for traders anticipating a continuation of the recovery momentum. The convergence of technical factors suggests LBLOCK may be positioned for further upside exploration in the coming sessions.
Invest wisely, and let Lucky Block’s potential work in your favor. You can purchase Lucky Block here. Buy LBLOCK.