Tamadoge (TAMA/USD) Bullish Trader Are Gathering Around $0.005.
Estimated Reading Time: 3 minutes
Don’t invest unless you’re prepared to lose all the money you invest. This is a high-risk investment and you are unlikely to be protected if something goes wrong. Take 2 minutes to learn more

Over the last few days, the TAMA/USD market has experienced a downward trend. In the preceding daily market session, the market turned decidedly bearish due to substantial selling pressure, leading to a decline below the $0.005 price level. Interestingly, this TAMA/USD price dip elicited significant bullish sentiment, ultimately prompting a rebound in the price after reaching the $0.0045 level.
Key Levels
- Resistance: $0.013, $0.014, and $0.015.
- Support: $0.0045, $0.0040, and $0.0035.
TAMA/USD Price Analysis: The Indicators’ Point of View
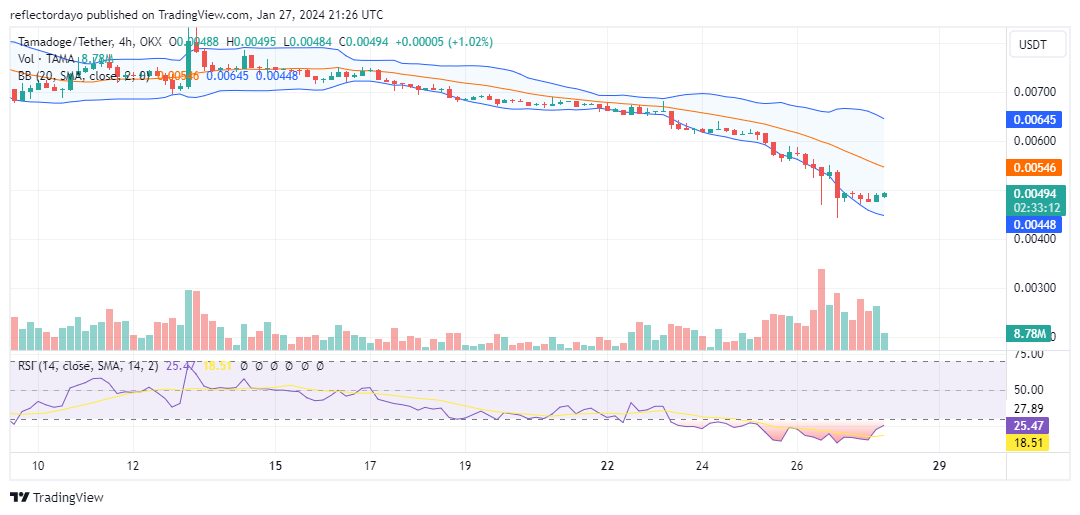
The TAMA/USD bear market observed yesterday led to a significant downward divergence in the lower standard deviation curve of the Relative Strength Index (RSI). Presently, the market appears to be entangled in a tug-of-war around the $0.005 price level. Despite this apparent consolidation around $0.005, there is a decline in trade volume, signaling a possible continuation of the consolidation phase at this level.
Observing the market’s sideways movement around $0.005, it appears unlikely that the price will drop further, suggesting the establishment of a strong support level. The RSI line of the Relative Strength Indicator has consistently remained below the 30 level, indicating an oversold condition. This crypto signal suggests a potential upcoming price rally, supporting the notion that the bear market may not extend further downward.
Tamadoge Short-Term Outlook: 1-Hour Chart
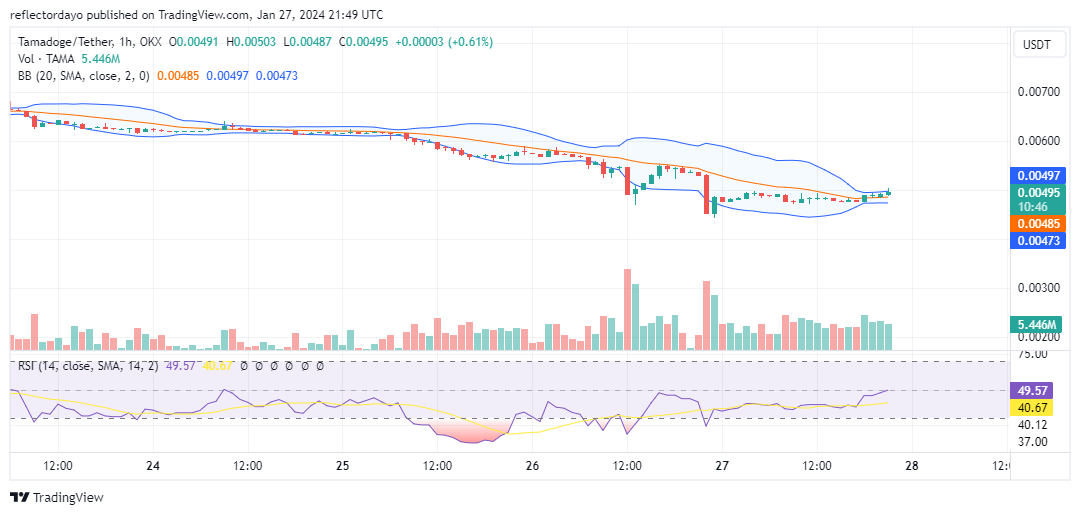
To validate the anticipated upward price swing, an examination of the 1-hour chart outlook reveals a narrowing of the Bollinger Bands amidst the ranging price action. While this suggests indecision, it also indicates that the market is poised to adopt a clear direction. Notably, the RSI line presently registers near the 50 level, marking a significant ascent from the oversold region and signaling progress by the bulls.
We’re about to release Tamadoge Pursuit, our new running game.
Our new runner game Tamadoge Pursuit is coming soon 🎉
Collect power ups to help you zoom downtown, through the park and onto the beach 🏖️😎
Launching on Android and iOS soon pic.twitter.com/C9mKnALPdQ
— TAMADOGE (@Tamadogecoin) January 18, 2024
Do you want a coin that will be 100 times more valuable in the next few months? That is Tamadoge. Buy TAMA today!