Polkadot Returns From the Recent High as It Risks Decline to $7.62
Estimated Reading Time: 2 minutes
Don’t invest unless you’re prepared to lose all the money you invest. This is a high-risk investment and you are unlikely to be protected if something goes wrong. Take 2 minutes to learn more

Free Crypto Signals Channel
Polkadot (DOT) Long-Term Analysis: Bullish
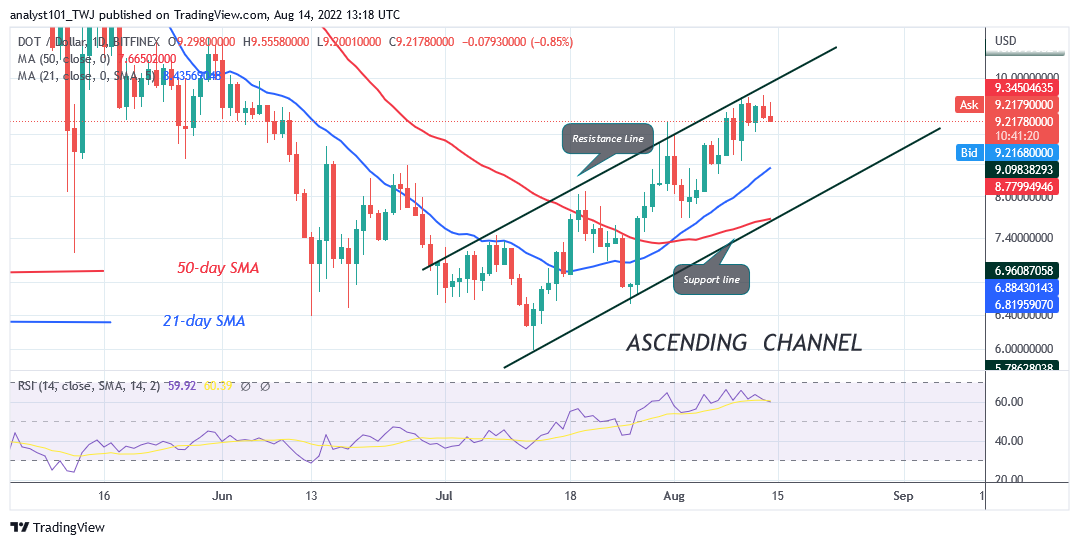
On August 10, Polkadot’s (DOT) price rallied to the high of $9.64 as it risks decline to $7.62. For the past 48 hours, the altcoin has been fluctuating below the $10 resistance zone. The cryptocurrency is likely to further rise to the upside. On the upside, if the $10 resistance is breached, buyers will attempt to push the altcoin to the highs of $10.79 and $11.84 price levels. Today, the altcoin is declining after facing rejection from the recent high. Nonetheless, if DOT/USD turns from the $10 high, the market will decline above the moving average lines or $9.20 support. In the meantime, DOT has declined to the low of $9.16.
Polkadot (DOT) Indicator Analysis
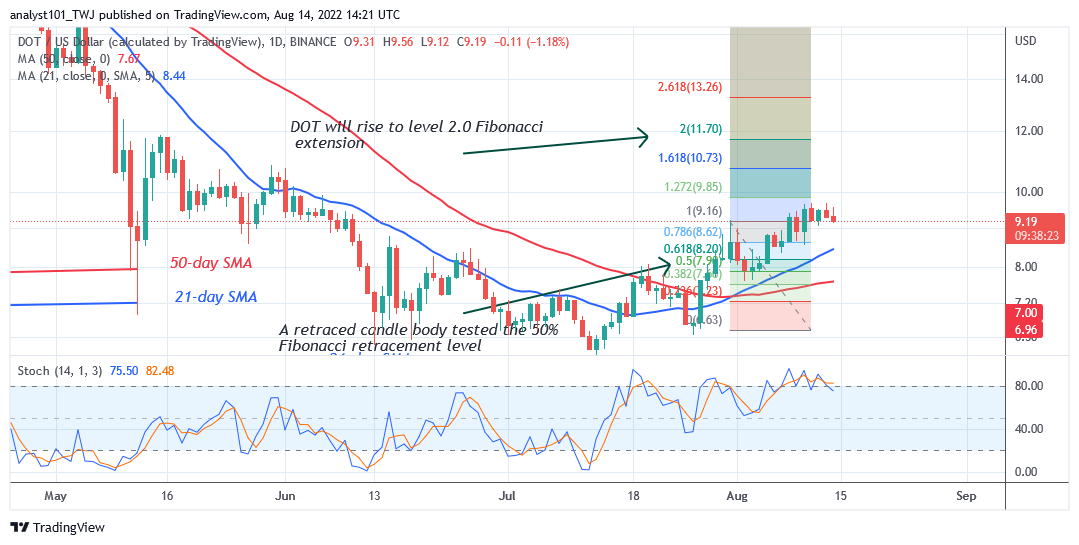
The cryptocurrency is at level 59 of the Relative Strength Index for period 14. The altcoin is in the bullish trend zone and may further rise. The altcoin’s price is above the 21-day line SMA and 50-day line SMA but it is facing rejection at the $10 resistance zone. DOT price is above the 80% range of the daily stochastic. It indicates that the current uptrend has reached the overbought region. There is a likelihood of a possible decline of the altcoin.
Technical indicators:
Major Resistance Levels – $10, $12, $14
Major Support Levels – $8, $6, $4
What Is the Next Direction for Polkadot (DOT)?
Polkadot has resumed its uptrend as it risks decline to $7.62 .The uptrend is stalled at the $10 resistance zone. The Fibonacci tool has indicated further upward movement of the coin. On July 31 uptrend, a retraced candle body tested the 50% Fibonacci retracement level. The retracement suggests that DOT will rise to level 2.0 Fibonacci extension or level $11.70.
You can purchase crypto coins here. Buy LBLOCK
Note: Cryptosignals.org is not a 1a financial advisor. Do your research before investing your funds in any financial asset or presented product or event. We are not responsible for your investing results