Tamadoge (TAMA/USD) Rebounds from $0.00065, Faces Resistance at $0.00071
Estimated Reading Time: 3 minutes
Don’t invest unless you’re prepared to lose all the money you invest. This is a high-risk investment and you are unlikely to be protected if something goes wrong. Take 2 minutes to learn more
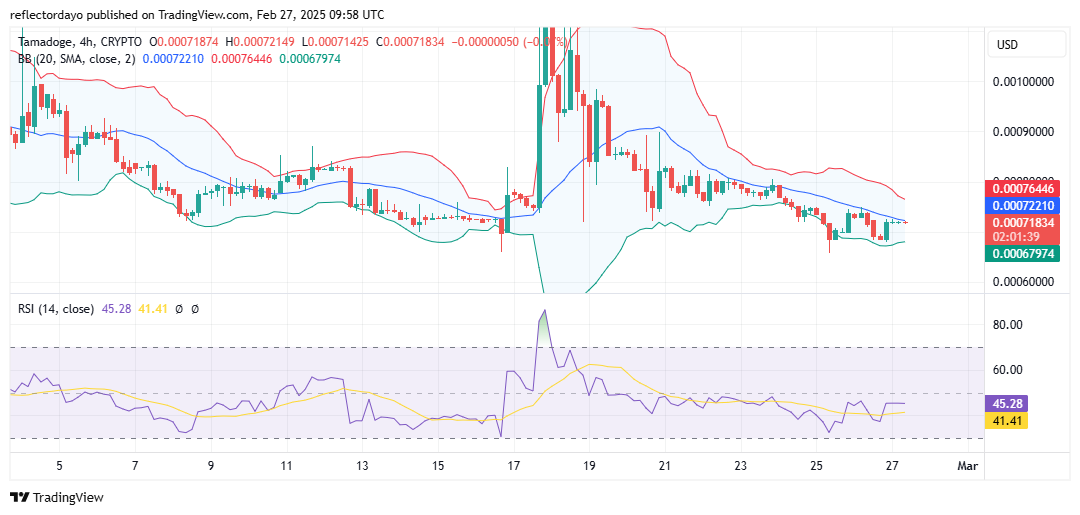
After reaching a local high of $0.0014, Tamadoge (TAMA/USD) experienced a downtrend, characterized by a series of lower highs until it found support at $0.00065. At this critical level, the market pivoted upward, initiating a rebound as buyers stepped in to defend the price.
Now, TAMA/USD is encountering resistance at $0.00071, where price action is under pressure. The 20-day moving average is currently positioned near this level, reinforcing its significance.
The market now stands at a crucial juncture—either it sustains the recovery and pushes higher, or bearish pressure forces another downturn.
Key Price Levels to Watch
- Resistance Levels: $0.0010, $0.0011, $0.0012
- Support Levels: $0.0007, $0.00065, $0.0006
TAMA/USD Price Analysis: What Do the Indicators Say?
The 20-day moving average continues to trend downward, signaling that bears maintain control. However, price action has stabilized around $0.00071, suggesting the possibility of a consolidation phase at this level.
A closer look at the last three 4-hour candlesticks reveals the formation of doji candles, indicating market indecision as buyers and sellers struggle for dominance. Over the past 12 hours, price action has remained range-bound, reflecting an equilibrium between supply and demand.
Given the gradual decline from $0.0014, bears still have an edge. However, if bulls continue to defend the $0.00065 level, consolidation could persist until buying momentum overwhelms selling pressure, leading to a potential breakout.
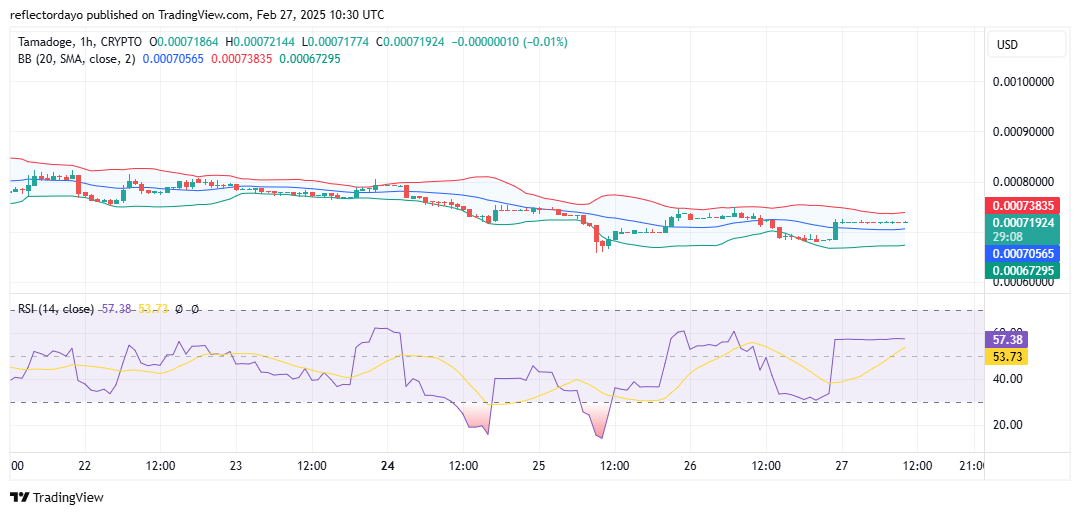
Tamadoge Short-Term Outlook: 1-Hour Chart
On a smaller time frame, trading activity appears stagnant, as evidenced by the four consecutive doji candlesticks aligning horizontally around $0.00071.
Despite this apparent stability, the Bollinger Bands indicate lingering volatility, with the price fluctuating between $0.00067 and $0.00073. Although the market has remained flat, the wide Bollinger Band range suggests that the aftereffects of recent price swings are still influencing volatility.
One crucial takeaway is that price stability at $0.00071 may signal accumulation by traders, often a precursor to a strong breakout in either direction. If bullish momentum prevails, TAMA/USD could push higher, but if bearish sentiment strengthens, the market may see another downward move before a decisive trend emerges.
Buy Tamadoge!
Fill your weekend by playing five exhilarating play-to-earn arcade games! 🕹️💰
Battle your way to the top of the weekly leaderboards and load up on $TAMA rewards!
Download on mobile now 👇
📱 Android: https://t.co/D4TjX7gTFl
📱 iOS: https://t.co/0fjJapf5oA pic.twitter.com/6MCruiKcet— TAMADOGE (@Tamadogecoin) September 13, 2024