Tamadoge (TAMA/USD) Rebounds from $0.00065, Faces a Test at $0.00071
Estimated Reading Time: 3 minutes
Don’t invest unless you’re prepared to lose all the money you invest. This is a high-risk investment and you are unlikely to be protected if something goes wrong. Take 2 minutes to learn more
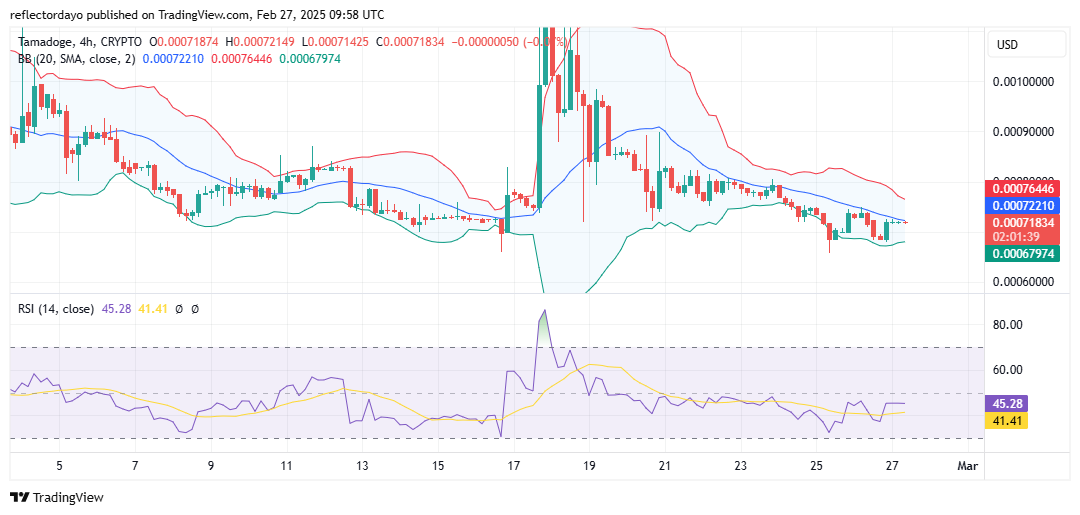
Following the previous high of $0.0014, the market experienced a decline, forming a series of lower highs until the price action reached the $0.00065 support level. At this point, the market made a pivotal upward turn, rebounding after testing this key support.
Tamadoge (TAMA/USD) has rebounded from $0.00065, but now faces resistance at $0.00071, where price action is being tested. The 20-day moving average is currently positioned near this level, adding further significance to the price reaction.
The key question remains: Will the market sustain its recovery or face renewed selling pressure?
Key Levels
- Resistance: $0.0010, $0.0011, and $0.0012
- Support: $0.0007, $0.00065 and $0.0006
TAMA/USD Price Analysis: The Indicators’ Point of View
The Tamadoge market is currently in a downward trend, as indicated by the 20-day moving average sloping downward. At around the $0.00071 price level, price action has flattened, suggesting the potential emergence of a consolidation phase at this level.
Notably, the last three consecutive candlesticks are doji formations, highlighting market stagnation at $0.00071 over the past three 4-hour trading sessions. This indicates that for the past 12 hours, the crypto signal has been caught between demand and supply, with buyers and sellers locked in a standoff.
Given the gradual decline from the $0.0014 peak, bears may still hold an advantage. However, if bulls maintain their strength—following the pivotal rebound at $0.00065—the consolidation could persist until bullish momentum overcomes bearish pressure, potentially leading to a strong upward breakout.
Tamadoge Short-Term Outlook: 1-Hour Chart
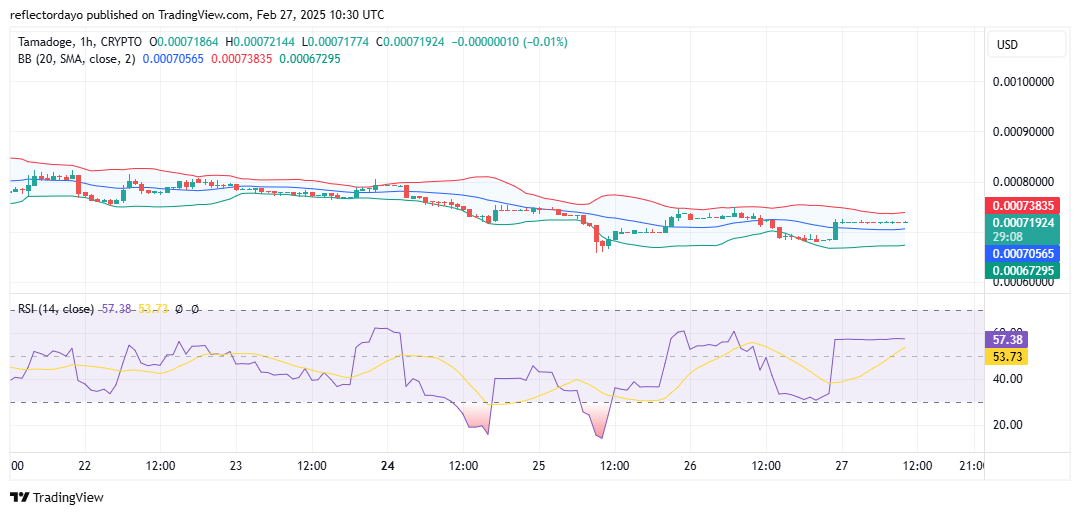
From a narrower perspective, trading activity appears to be at a standstill, as evidenced by the horizontal alignment of four consecutive doji candlesticks, indicating that the market is pegged around $0.00071.
Despite this apparent stability, the Bollinger Bands indicate substantial volatility, with a bandwidth ranging between $0.00067 and $0.00073. Although price stagnation has persisted for a significant period, the bandwidth remains wide, likely due to the lingering effects of the recent surge in volatility.
Another key observation is that price stability at $0.00071 could suggest that some traders are accumulating positions, which often serves as a precursor to a breakout.
Buy TAMA!
Fill your weekend by playing five exhilarating play-to-earn arcade games! 🕹️💰
Battle your way to the top of the weekly leaderboards and load up on $TAMA rewards!
Download on mobile now 👇
📱 Android: https://t.co/D4TjX7gTFl
📱 iOS: https://t.co/0fjJapf5oA pic.twitter.com/6MCruiKcet— TAMADOGE (@Tamadogecoin) September 13, 2024