Tamadoge (TAMA/USD) Poised for a Potential Bullish Rebound
Estimated Reading Time: 3 minutes
Don’t invest unless you’re prepared to lose all the money you invest. This is a high-risk investment and you are unlikely to be protected if something goes wrong. Take 2 minutes to learn more
The previous analysis of the Tamadoge market highlighted a strong bullish surge, with prices reaching as high as $0.0014 within a short period. This sharp upward movement triggered increased volatility, leading to significant price swings.
Although the bears quickly capitalized on the heightened volatility, pushing the market to form lower peaks, the peaks gradually descended as market fluctuations subsided and price movements stabilized. As this scenario unfolded, a support level began to emerge at $0.0008, following a bounce from $0.00075, which subsequently became a pivotal support level.
Currently, the $0.0008 support level has been holding strong for several sessions, with market forces converging around this zone. Traders will be closely monitoring whether this support holds firm or if further price action signals the next major move in the crypto market.
Key Levels
- Resistance: $0.0010, $0.0011, and $0.0012
- Support: $0.0007, $0.00065 and $0.0006
TAMA/USD Price Analysis: The Indicators’ Point of View
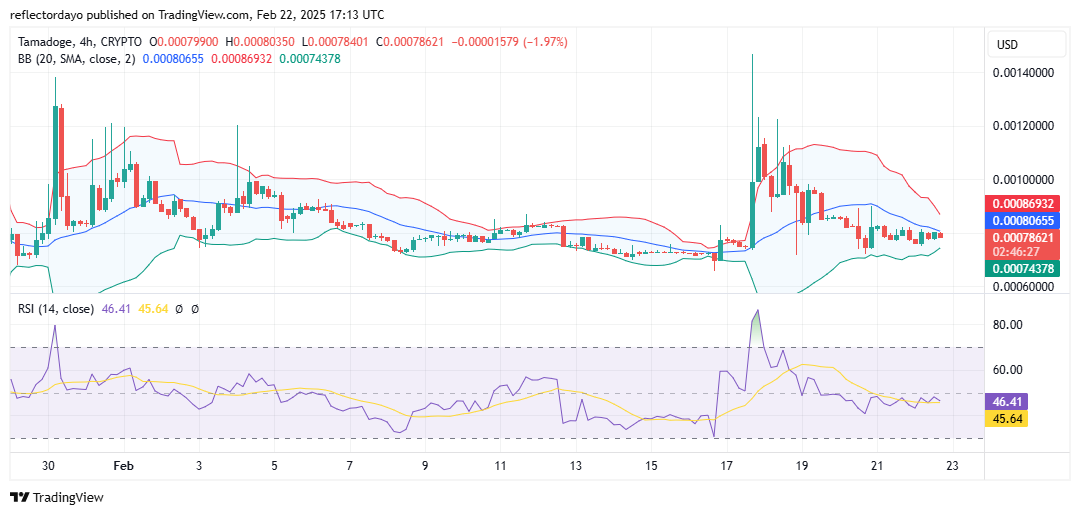
The $0.008 price level has remained a key support since the onset of the recent bullish surge. This level has held firm, and the Tamadoge market forces are now converging around it. Both support and resistance are tightening near this zone, as clearly illustrated by the Bollinger Bands indicator. The bandwidth is contracting significantly, reflecting reduced volatility while support remains steady at $0.008.
However, despite the bulls’ resilience, they are under considerable bearish pressure. This is evident in the Relative Strength Index (RSI), which is moving sideways around 46, indicating market indecision. If the bulls continue to defend this level, they could eventually exhaust the bearish momentum, leading to a breakout—similar to the recent price action.
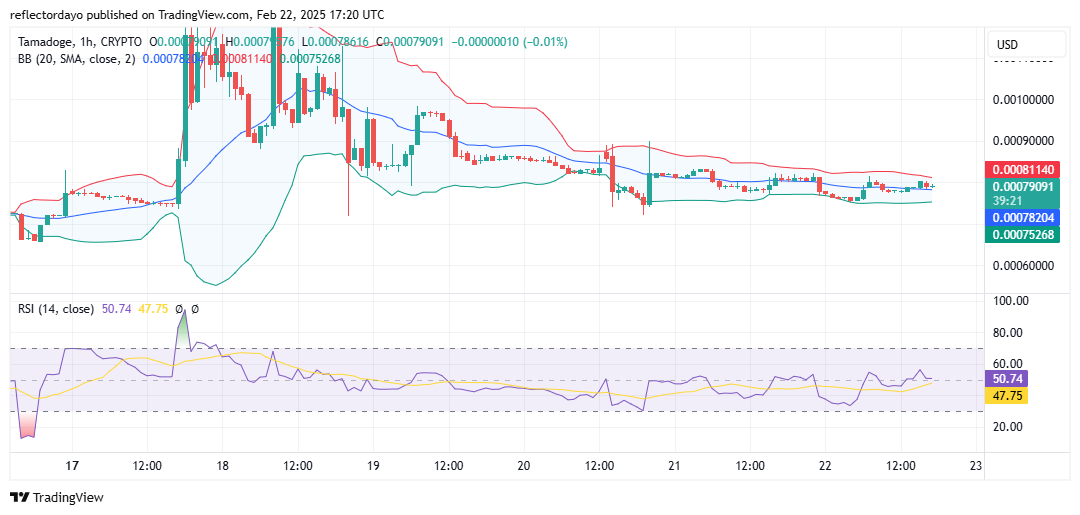
Tamadoge Short-Term Outlook: 1-Hour Chart
The resilience of Tamadoge buyers is further evident in the 1-hour chart outlook. Price action is ranging sideways along the $0.008 level, oscillating within a narrow channel. However, there appear to be more swing lows than swing highs, suggesting that sellers have a slight upper hand.
Nevertheless, if the bulls continue to defend this level, the market may eventually break out. The current bearish pressure within this consolidation phase could simply be a residual effect of the strong correction that followed the recent bullish surge.
Buy TAMA/USD!
Fill your weekend by playing five exhilarating play-to-earn arcade games! 🕹️💰
Battle your way to the top of the weekly leaderboards and load up on $TAMA rewards!
Download on mobile now 👇
📱 Android: https://t.co/D4TjX7gTFl
📱 iOS: https://t.co/0fjJapf5oA pic.twitter.com/6MCruiKcet— TAMADOGE (@Tamadogecoin) September 13, 2024