Lucky Block Price Prediction: LBLOCK/USD Would Spike Above $0.0030 Level
Estimated Reading Time: 2 minutes
Don’t invest unless you’re prepared to lose all the money you invest. This is a high-risk investment and you are unlikely to be protected if something goes wrong. Take 2 minutes to learn more

Free Crypto Signals Channel
As soon as the bulls increase their momentum, the Lucky Block price prediction will break up the $0.0030 level.
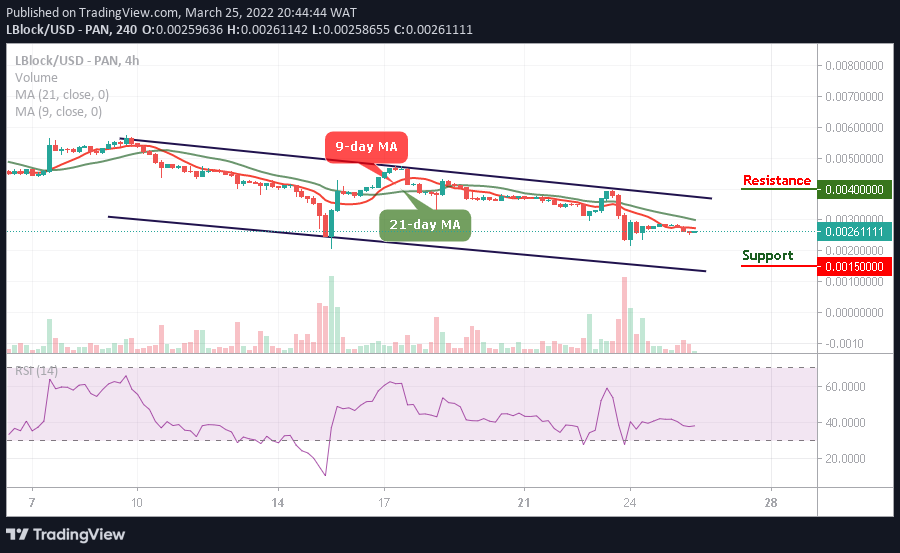
LBLOCK/USD Medium-term Trend: Ranging (4H Chart)
Key Levels:
Resistance levels: $0.0040, $0.0045, $0.0050
Support levels: $0.0015, $0.0010, $0.0005
On the 4-hour chart, LBLOCK/USD is below the 9-day and 21-day moving averages as the bullish pressure would prepare to break up the resistance level of $0.0030 level. However, if the bulls fail to push the price higher, the Lucky Block price may consolidate for a while so that more buyers can enter the market.
Lucky Block Price Prediction: LBLOCK/USD Will Follow bullish Movement
The Lucky Block price is changing hands at $0.0026 where it retreats slightly, but if the coin continues the current movement and crosses above the 9-day and 21-day moving averages, the coin may locate the potential resistance levels at $0.0040, $0.0045, and $0.0050 while the support levels may surface at $0.0015, $0.0010, and $0.0005 respectively which may allow the new entries as the technical indicator Relative Strength Index (14) moves below 40-level.
LBLOCK/USD Medium-term Trend: Ranging (2H Chart)
On the 2-hour chart, the Lucky Block price remains below the 9-day and 21-day moving averages with a bullish candle. Meanwhile, the technical indicator Relative Strength Index (14) also moves to cross above 40-level which may push the coin to the upside. Any further bullish movement above the 9-day and 21-day moving averages will hit the resistance level at $0.0040 and above.
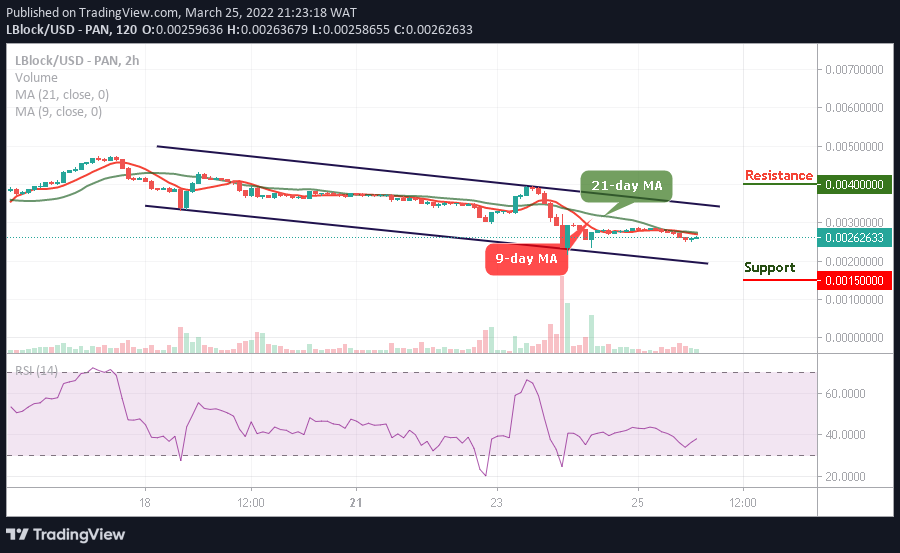
However, LBLOCK/USD would experience more bullish signals once the coin crosses to the upside, but if the price drop below the current market value at $0.0026, it could touch the critical support at $0.0015 and below to allow the existing buyers to buy the dip.
Read more: