DeFi Coin Price Prediction: DEFC/USD Turns Lower; More Buyers Will Play Out
Estimated Reading Time: 2 minutes
Don’t invest unless you’re prepared to lose all the money you invest. This is a high-risk investment and you are unlikely to be protected if something goes wrong. Take 2 minutes to learn more
DeFi Coin Price Prediction – October 13
The DeFi Coin price prediction would begin to form higher as the coin slides below the 9-day and 21-day moving averages.
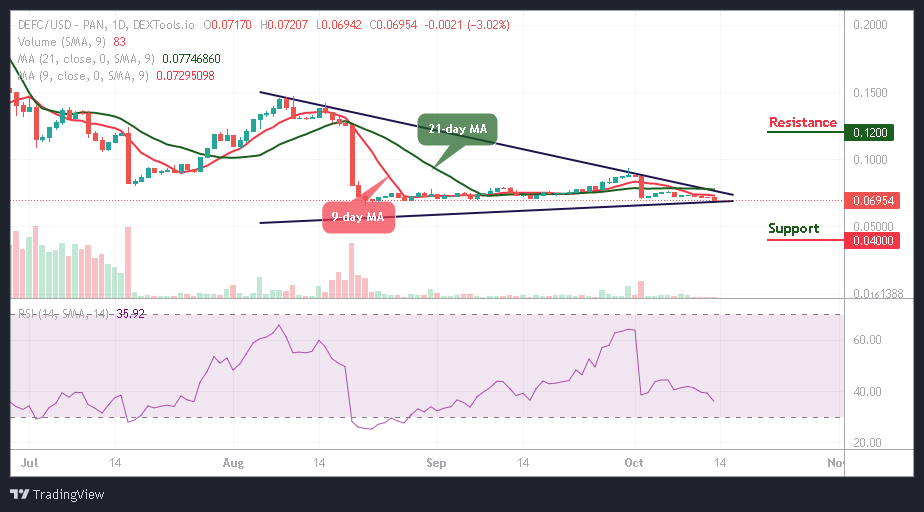
DEFC/USD Medium-term Trend: Ranging (1D Chart)
Key Levels:
Resistance levels: $0.12, $0.13, $0.14
Support levels: $0.04, $0.03, $0.02
DEFC/USD is trading below the 9-day and 21-day moving averages as the market price hovers around $0.069, and the DeFi Coin could head to the south to allow new investors to come into focus.
DeFi Coin Price Prediction: DEFC/USD Would Break to the Upside
The DeFi Coin price would begin to rise and break above the upper boundary of the channel as soon as the bulls push the coin above the 9-day and 21-day moving averages. However, any further bullish movement above the upper boundary of the channel may push the coin to the potential resistance levels of $0.12, $0.13, and $0.14.
In the meantime, this technical analysis may be delayed if the sellers break below the lower boundary of the channel, and the market price hits the support levels of $0.04, $0.03, and $0.02. Moreover, the technical indicator Relative Strength Index (14) remains below the 40-level to prepare the coin for the bullish movement if it reverses.
DEFC/USD Medium-term Trend: Bearish (4H Chart)
On the 4-hour chart, the DeFi Coin price continues to move below the 9-day and 21-day moving averages, touching the support at $0.069. However, the long-term moving averages will begin the bullish movement once the coin crosses above the upper boundary of the channel, and the market will prepare for a new trend.
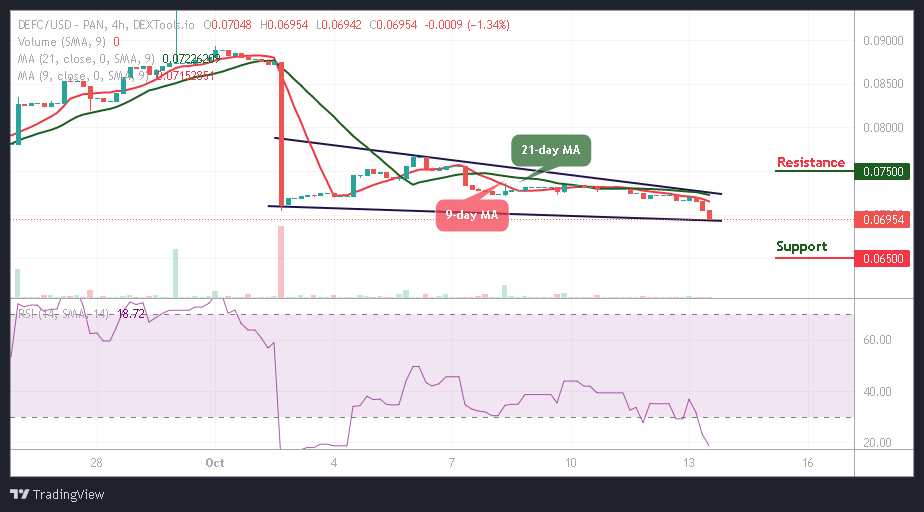
If the buyers push the price to the upside, higher resistance could be reached at $0.075 and above, while the technical indicator Relative Strength Index (14) slides into the oversold region. Moreover, should the bulls fail to move the current market value above, the bears may bring the coin to the nearest support level at $0.065 and below.
You can purchase DeFi Coin here. Buy DEFC