Polygon (MATIC/USD) Market Sets for Reclaiming Swing Highs
Estimated Reading Time: 3 minutes
Don’t invest unless you’re prepared to lose all the money you invest. This is a high-risk investment and you are unlikely to be protected if something goes wrong. Take 2 minutes to learn more
Polygon Price Prediction – June 4
Bears’ business reactions surfaced toward the $0.080 support line several days ago as the MATIC/USD market has set for reclaiming swing highs. Over some hours of trading back, the price has positioned at $0.904 and $0.0895 value lines at a minute positive percentage rate of 0.44. As long as the transaction remains staged between well-defined range bounds of $1 and $0.80, buying is the trading strategy system to possess the ideal predominance probability to prevail in the market.
MATIC/USD Market
Key Levels
Resistance levels: $1, $1.05, $1.10
Support levels: $0.80, $0.75, $0.70
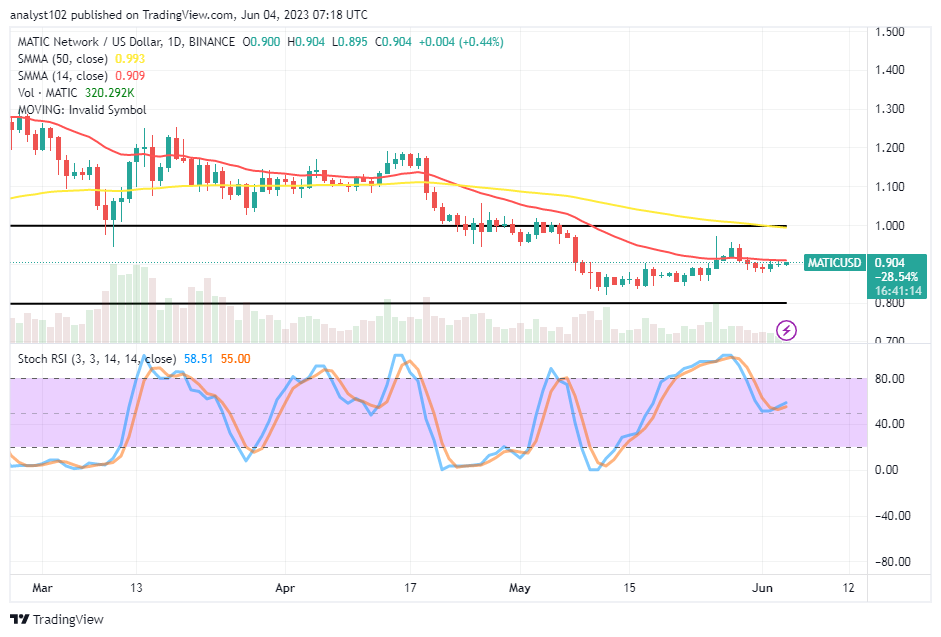
MATIC/USD – Daily Chart
The MATIC/USD daily chart t showcases the cryptocurrency’s valuation sets for reclaiming swing highs between $1 and $0.80. In pursuance of that, the positioning of the Oscillators portends a tentative path to the north side, as the 14-day SMA indicator is at the $0.909 line, underneath the $0.993 value point of the 50-day SMA indicator. The Stochastic Oscillators are at 55.00 to 58.51, suggesting the possibility of the price running into creating a baseline over $0.85.
Can the MATIC/USD market bears at $0.80 survive a more long-term terrified breakdown of values?
There might not be reliable downs even in the MATIC/USD market operations, even if the crypto-economic price tends to forcibly produce in a decline direction as against the observation that it has set for reclaiming swing highs. In the meantime, long-position takers should uptake their stances over the line of $0.85 against the potentiality of any possible swing low that could show up in a bid to revisit the support level at $0.80.
On the decreasing manner of the MATIC/USD market analysis, it would be better for short-position placers to most of the times use the reading of the Stochastic Oscillators to determine the near probable moment that could lead to an exhaustion of a rise backing with a formation of bearish candlesticks before taking to shorting position orders. A sudden desire position order followed by a top shadow candlestick would indicate a swift end to gaining stable-ups that may result from breaking out of the cryptocurrency’s resistances directly above the $1.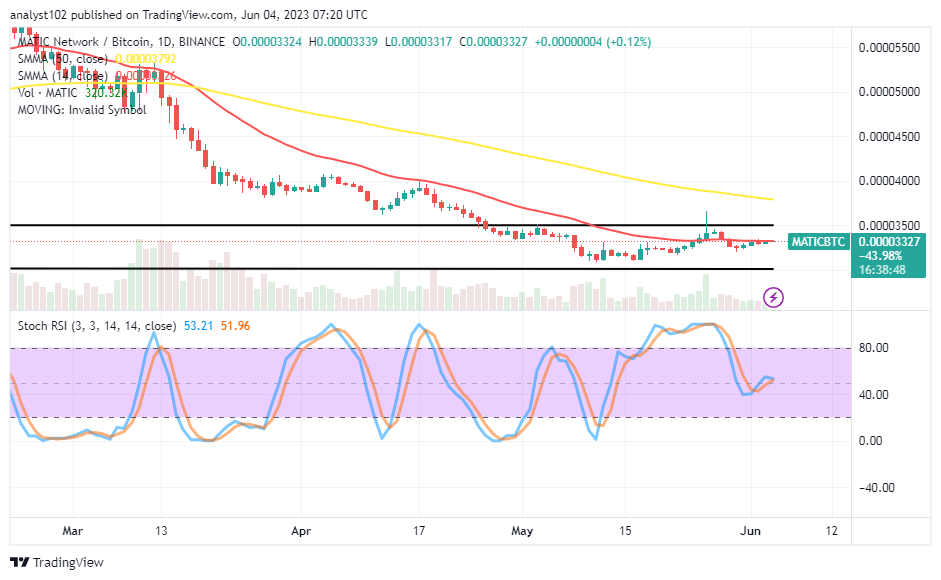
MATIC/BTC Price Analysis
In contrast, Polygon is getting set toward reclaiming swing highs against Bitcoin, following the variant candlesticks that made a close above the lower range line drawn at B0.00001000. Currently, the price is at B0.00003327, around the 14-day SMA indicator below the 50-day SMA indicator. The Stochastic Oscillators are around 53.21 to 51.96 points, signifying the possibility of running a decline or causing another condition characterized by pit stops. Overall, if the smaller indication breaks northward in the long run, the counter-trading cryptocurrency may not have the opportunity of staying too long in the market.
Note: Cryptosignals.org is not a financial advisor. Do your research before investing your funds in any financial asset or presented product or event. We are not responsible for your investing results.
You can purchase Lucky Block here. Buy LBLOCK