Decentraland (MANA/USD) Tests Critical Support at Mid-Bollinger Band
Estimated Reading Time: 3 minutes
Don’t invest unless you’re prepared to lose all the money you invest. This is a high-risk investment and you are unlikely to be protected if something goes wrong. Take 2 minutes to learn more

Decentraland Price Analysis – MANAUSD Bullish Momentum is Waning
Decentraland (MANA/USD) market is currently at a critical inflection point as the price tests the 20-day simple moving average for support. After a strong rally earlier in the month was halted at resistance, the subsequent pullback has brought the market to this “make-or-break” level, which will likely determine the next directional trend.
MANA/USD Market Key Levels:
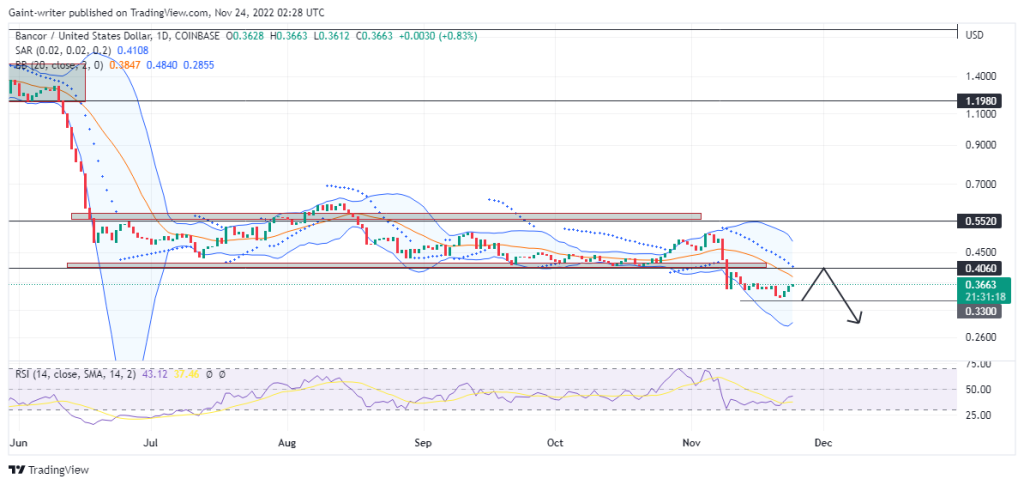
Resistance levels: $0.3396, $0.4080, $0.5370
Support levels: $0.2410, $0.1940

The daily chart shows that after a robust rally from the June lows, MANA was sharply rejected at the $0.3396 resistance level. The price has since corrected downwards and is now sitting directly on the middle Bollinger Band (around $0.3070). This moving average is a crucial pivot. A strong bounce from this level would confirm it as dynamic support and keep the bullish structure intact. Conversely, a decisive break below it would signal that sellers have taken control and a deeper correction is likely.
The immediate future for MANA hinges on its reaction to the middle Bollinger Band. If buyers step in and defend this level, a bounce back towards the $0.3396 resistance is the most probable scenario. A breakout above that resistance would re-ignite the uptrend, with $0.4080 as the next target.
However, if the support fails and the price closes below the middle band, the market is likely to fall towards the lower Bollinger Band and the major horizontal support at $0.2417. The Money Flow Index (MFI) remains above the 50 level, indicating that positive money flow is still present.

Market Expectation
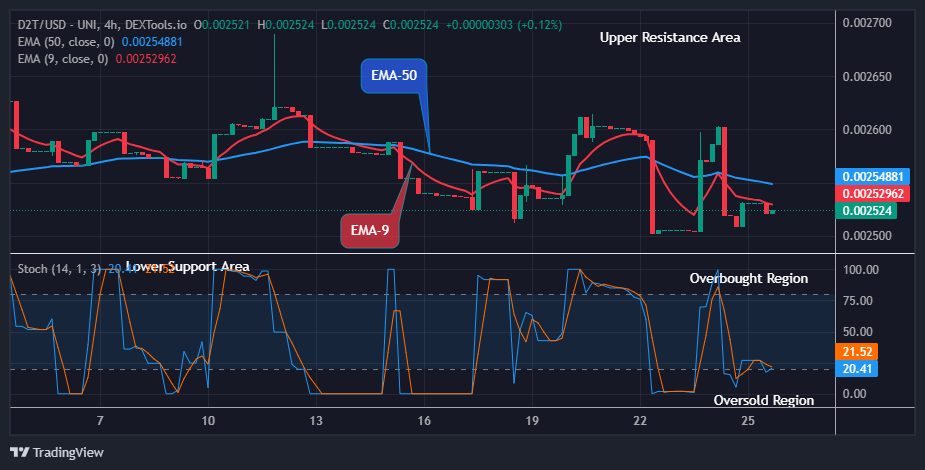
The 4-hour chart provides a closer look at the market’s indecision. The Bollinger Bands are squeezing tightly, indicating that volatility is contracting and a significant price move is imminent. Interestingly, the MFI on this timeframe is relatively high, suggesting that some accumulation or buying interest may be occurring at these support levels despite the lack of upward price movement. A break above the 4-hour middle band (around $0.3181) would be the first confirmation of renewed bullish strength.
You can purchase Lucky Block here. Buy LBLOCK
Note: Cryptosignals.org is not a financial advisor. Do your research before investing your funds in any financial asset or presented product or event. We are not responsible for your investing results