Uniswap (UNI/USD) Trade Extends Low, Moving in Channels
Don’t invest unless you’re prepared to lose all the money you invest. This is a high-risk investment and you are unlikely to be protected if something goes wrong. Take 2 minutes to learn more

Uniswap Price Prediction – September 14
Since the last signal confirmation was made at the crossing of indicators around the point of $5.50 between the 16th and 17th days in the UNI/USD market operations, given that the crypto trade extends low, moving in channels mostly characterized by smaller bearish candlesticks,
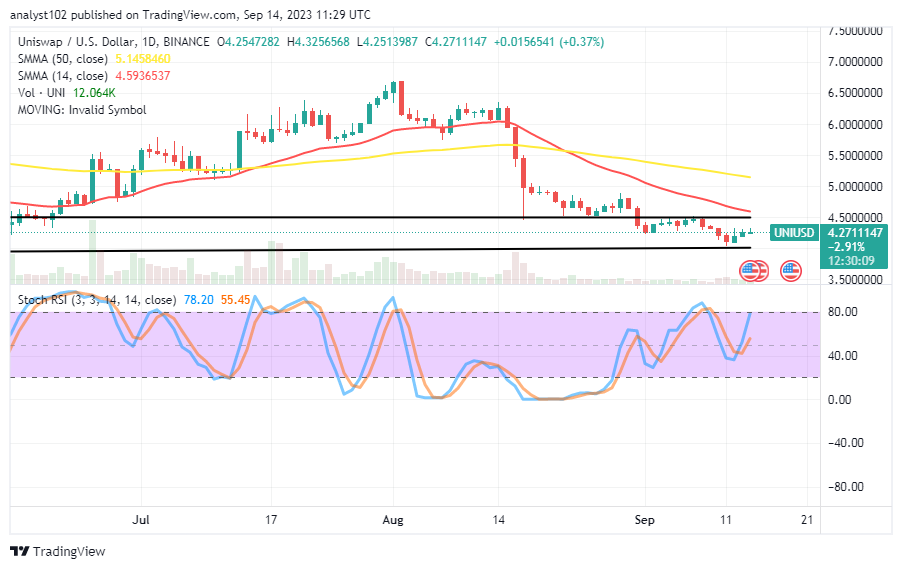
Seller reactions have pushed for range-bound positions between $4.50 and $4 through a series of trade lines. Bulls don’t seem to be poised for an optimal capacity stance toward coming back with an aggressive sign to push quickly upward in light of weighing the velocity to the upside against the higher point. However, if there are lower decreases, investors may have a decent opportunity by repurchasing from within those values or even below them.
UNI/USD Market
Key Levels:
Resistance levels:$4.50, $5, $5.50
Support levels: $4, $3.50, $3
UNI/USD – Daily Chart
The UNI/USD daily chart reveals the crypto trade extends low, moving in channels of range bounds of $4.50 and $4, running into several days back.
The 50-day SMA trend line is located at $5.1458460, and the 14-day SMA trend line is at $4.5936537. The two horizontal lines drawn have been staged intact, marking the logical points of the up and the down. Between 55.45 and 78.20, the stochastic oscillators have crossed northward from the point of 40. Less actively, a positive rising mode has been active.
What higher trade spot would the UNI/USD market bulls be logically confronting?
The awaiting barrier-trading line against the UNI/USD market buyers is around the resistance of $4.50, coupled with the backing of the smaller moving average, given that the crypto business extends low, moving in channels of definite range bounds.
When they notice a complementary position between the 4-hour and 1-hour charts, demonstrating that selling activities are on the verge of losing the chance of moving back lower, long-position pushers may move in tandem with the current increasing pressure to the upside.
If there are any points between the upper horizontal line and the 14-day SMA trend line, sellers must wait for opportunities to reclaim entry positions around that higher line before selling. Because of a depression-like attitude that has developed over time, bears must exercise extreme caution.
UNI/BTC Price Analysis
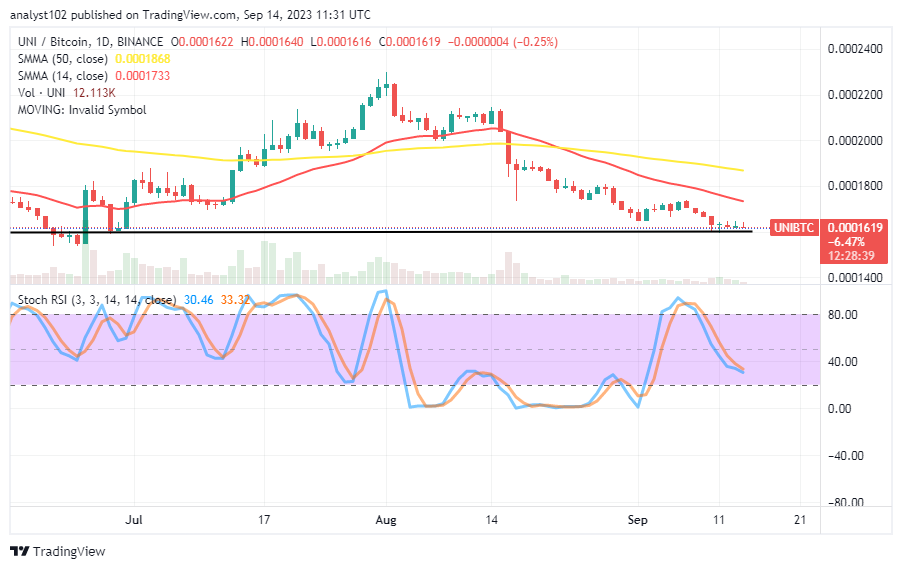
In contrast, Uniswap trade extends in lows, moving in channels of range bounds against the trending power of Bitcoin.
A distance has surfaced between the 14-day SMA indicator’s placement beneath the 50-day SMA indicator. The Stochastic Oscillators are currently positioned between 33.32 and 30.46 while traveling south. The candlestick formation has been showing signs of relaxation at the lower horizontal line for around three days.
Note: Cryptosignals.org is not a financial advisor. Do your research before investing your funds in any financial asset or presented product or event. We are not responsible for your investing results.
You can purchase Lucky Block here. Buy LBLOCK


