Uniswap (UNI/USD) Trade Pulls Up, Setting in Ranges
Don’t invest unless you’re prepared to lose all the money you invest. This is a high-risk investment and you are unlikely to be protected if something goes wrong. Take 2 minutes to learn more

Uniswap Price Prediction – September 8
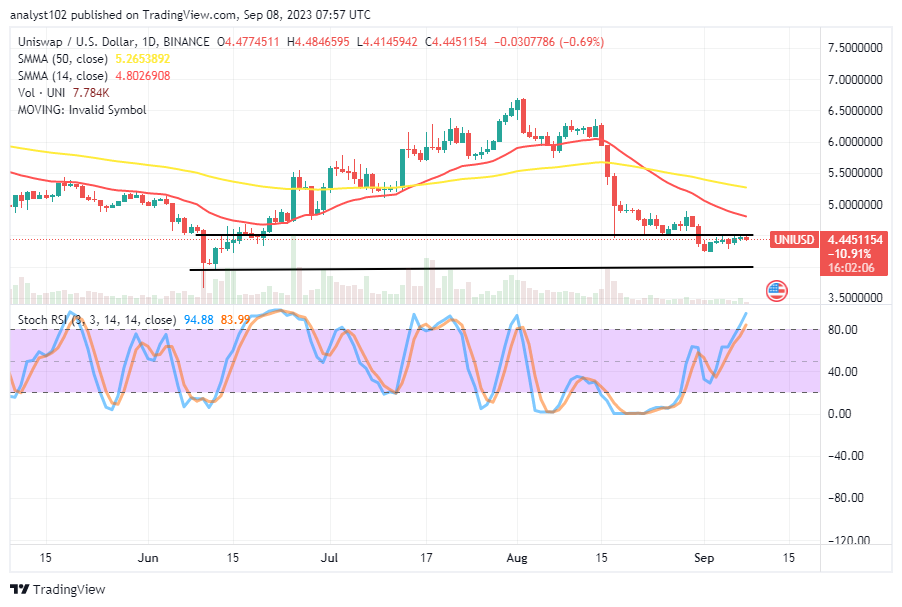
The market operation of Uniswap has been experiencing a fall-off at a maximal capacity that has made the situation change to make the crypto-economic trade pull up, setting in ranges marked by $4.50 and $4.
The higher-value line is first considered to be the most important trading area to avoid experiencing more sustained free falls. The resistance level of $5 continues to exert pressure on the price, and the high and low values are found between $5.2653892 and $4.8026908. It looks like purchasers will still need to regain their momentum by starting from a lower location—even if that lower area is not $4 after—in order to restore the lost values.
UNI/USD Market
Key Levels:
Resistance levels:$5, $5.50, $6
Support levels: $4, $3.50, $3
UNI/USD – Daily Chart
The UNI/USD daily chart reveals the crypto business pulling up, setting in ranges between the spots of $4.50 and $4.
The 14-day SMA indicator is at $4.8026908 underneath the $5.2653892 value line of the 50-day SMA indicator. And they are featured above the range-bound zones. The stochastic oscillators have stretched northbound into the overbought region to portend market power from 83.99 to 94.88.
What reading speed are the stochastic oscillators on the UNI/USD market showing right now?
Presently, both the positioning posture and the values given by the UNI/USD market’s Stochastic Oscillators suggest that a long position order from or around $4.50 risks losing relatively as the crypto pulls up, setting in ranges.
As things stand, we hold the psychological opinion that purchasers won’t ultimately lose as much money from the lower range line at $4. In another sense, buyers should start using the strategy of purchasing at a discount to the moving averages’ trend lines.
A false push that will average the point of the lesser SMA will only result in touching or testing resistance around the 14-day SMA to allow it to resume an active southerly reversal moment. The areas between its two moving averages’ points must be the most competitive barrier-trading zones.
UNI/BTC Price Analysis
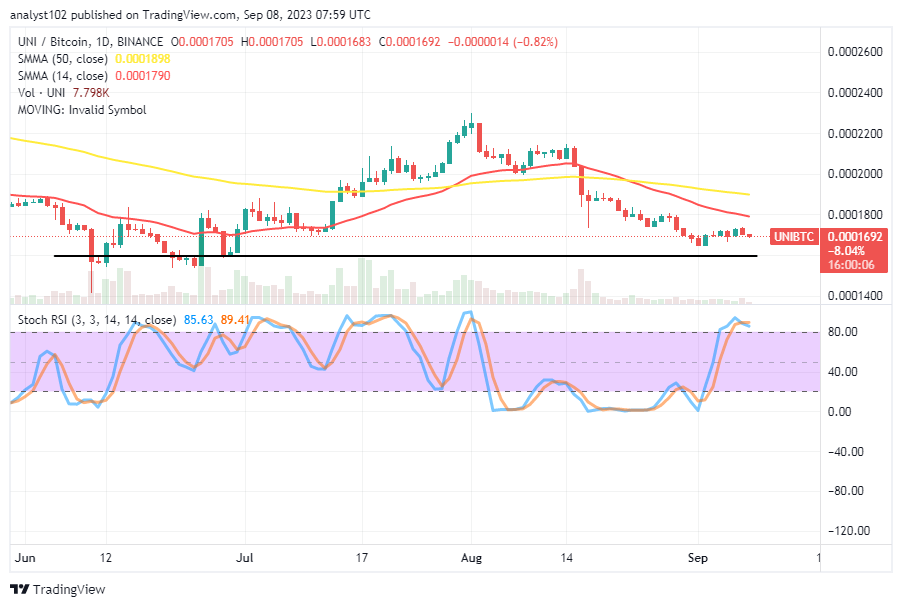
In contrast, the Uniswap market, at the time of writing this technical piece, was pulling up, setting in ranges below the trend lines of the moving averages.
It is higher than the 14-day SMA trend line and the 50-day SMA. The stochastic oscillators are marginally positioned southerly from 89.41 to 85.63 values and are in the overbought region. This suggests that the counter cryptocurrency still has the potential to become more gloomy than its base counterpart.
Note: Cryptosignals.org is not a financial advisor. Do your research before investing your funds in any financial asset or presented product or event. We are not responsible for your investing results.
You can purchase Lucky Block here. Buy LBLOCK
