Polkadot (DOT) Hovers Above $22, May Resume Selling Pressure
Estimated Reading Time: 2 minutes
Don’t invest unless you’re prepared to lose all the money you invest. This is a high-risk investment and you are unlikely to be protected if something goes wrong. Take 2 minutes to learn more
Polkadot (DOT) Long-Term Analysis: Bullish
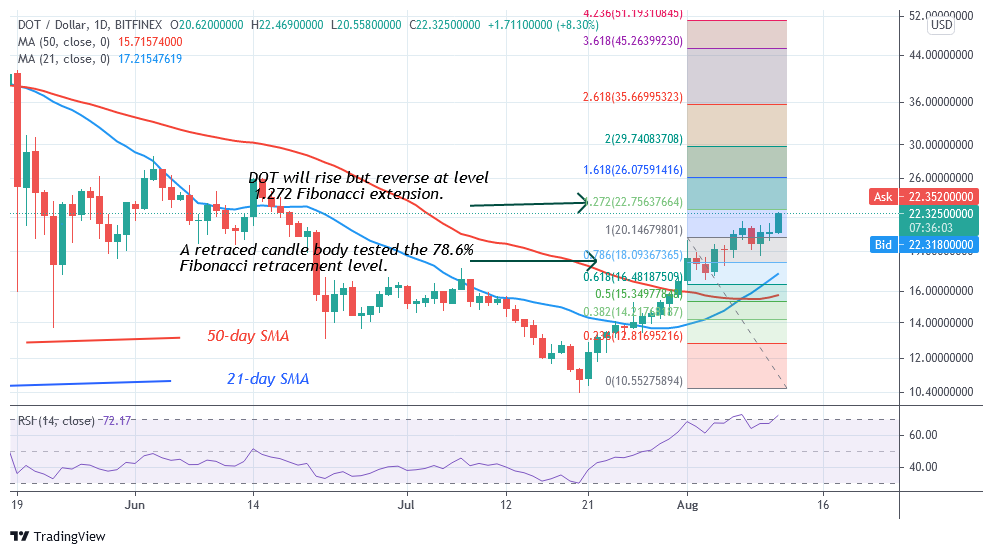
Polkadot’s (DOT) price reached the high of $22.46 and pulled back. DOT price has been hovering above the $22 price level for the past 24 hours. The upward move is doubtful as the market reaches the overbought region. The market has been overbought region since August 9. Meanwhile, on August 1 uptrend; a retraced candle body tested the 78.6% Fibonacci retracement level. The retracement indicates that DOT price will rise but reverse at level 1.272 Fibonacci extension or level $22.75.
Polkadot (DOT) Indicator Analysis
DOT price is at level 71 of the Relative Strength Index period 14. The altcoin upward move is doubtful as it reaches the overbought region. There is a tendency for the coin to fall. The daily stochastic has also indicated that the crypto is in the overbought condition above the 80% range. The market will decline as sellers emerge to push prices down. The crypto’s price is in the bullish trend zone as price bars are above the moving averages.
Technical indicators:
Major Resistance Levels – $48, $52, $56
Major Support Levels – $32, $28, $24
What Is the Next Direction for Polkadot (DOT)?
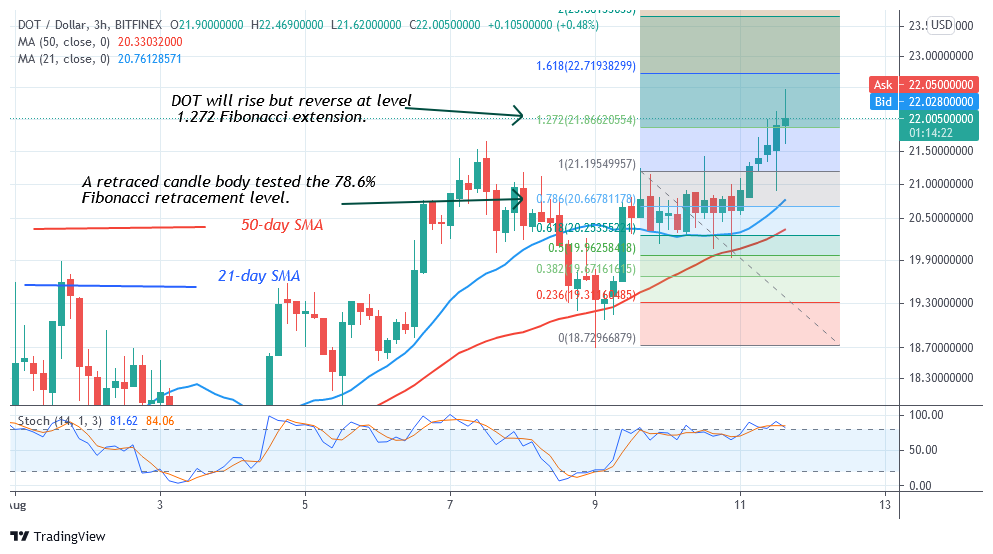
The crypto’s upward move has been stagnant as the market reaches the overbought region. Meanwhile, on August 9 uptrend; a retraced candle body tested the 78.6% Fibonacci retracement level. The retracement indicates that the DOT price will rise but reverse at level 1.272 Fibonacci extension or level $21.86. From the price action, the market has retraced to the 1.272 Fibonacci level.
You can purchase crypto coins here. Buy Tokens
Note: Cryptosignals.org is not a financial advisor. Do your research before investing your funds in any financial asset or presented product or event. We are not responsible for your investing results