XRP (XRP/USDT) Consolidates Above Dynamic Support: Breakout or Breakdown Looms?
Estimated Reading Time: 3 minutes
Don’t invest unless you’re prepared to lose all the money you invest. This is a high-risk investment and you are unlikely to be protected if something goes wrong. Take 2 minutes to learn more
XRP Long-term Analysis: Ranging
The XRP market against the Tether surged significantly at the beginning of 2025 but is now entering a consolidation phase as volatility compresses and price action tightens. However, XRP is testing a key zone where short-term bulls and long-term holders converge.
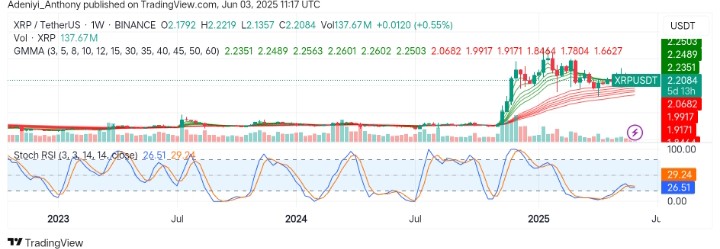
Recently, the pair has pulled back from its highs near $2.6000, finding stability around the GMMA short-term ribbon zone, which is acting as a dynamic support cluster. However, the volume has declined, showing a pause in buying pressure, and the Stochastic RSI is bottoming out near 26.51, suggesting a potential bullish crossover from oversold territory.
Currently, XRP trades at $2.2084, printing over 137.67 million for the week.
Technical Indicators
Major Resistance Levels: $2.2600, $2.3500, and $2.6000
Major Support Levels: $2.0700, $1.9900, and $1.7800
XRP/USDT Analysis
On the weekly chart, XRP against the Tether appears to be curling with a compression in the GMMAs, hinting at a larger move ahead. However, the cluster of exponential moving averages suggests the market still maintains a bullish stance.
From another angle, the Stochastic RSI is hovering around 26, near oversold territory. However, a bullish crossover from these levels typically precedes rallies, but the declining volume suggests consolidation.
To this end, a close above $2.2500 would signify continued upside movement; otherwise, a fall in value below $2.070 would indicate a breakdown.
XRP/USDT Analysis: Expectations
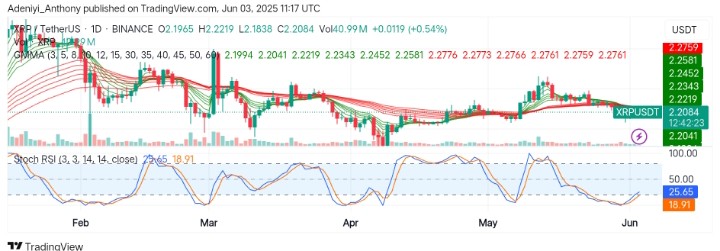
On the daily chart, XRP/USDT is holding just above the $2.20 level, hugging the lower edge of the short-term GMMA cluster. However, the GMMA ribbons appear to be compressing, signaling declining momentum and setting up for a directional break.
The Stochastic RSI, on the other hand, is rising from oversold, suggesting a potential bullish reversal is brewing. However, the short-term structure favors a northbound movement, as the bulls defend the critical support zone.
To this end, a close above the $2.2200 level may trigger upside continuation, while a breakdown below $2.2000 opens a bigger retracement risk.
You can purchase crypto coins here. Buy LBlock


