Bancor (BNTUSD) Breaks Downward Following Triangle Pattern Outcome
Estimated Reading Time: 2 minutes
Don’t invest unless you’re prepared to lose all the money you invest. This is a high-risk investment and you are unlikely to be protected if something goes wrong. Take 2 minutes to learn more

Free Crypto Signals Channel
Bancor Breaks Downward in Accordance to It’s Symmetric Triangle
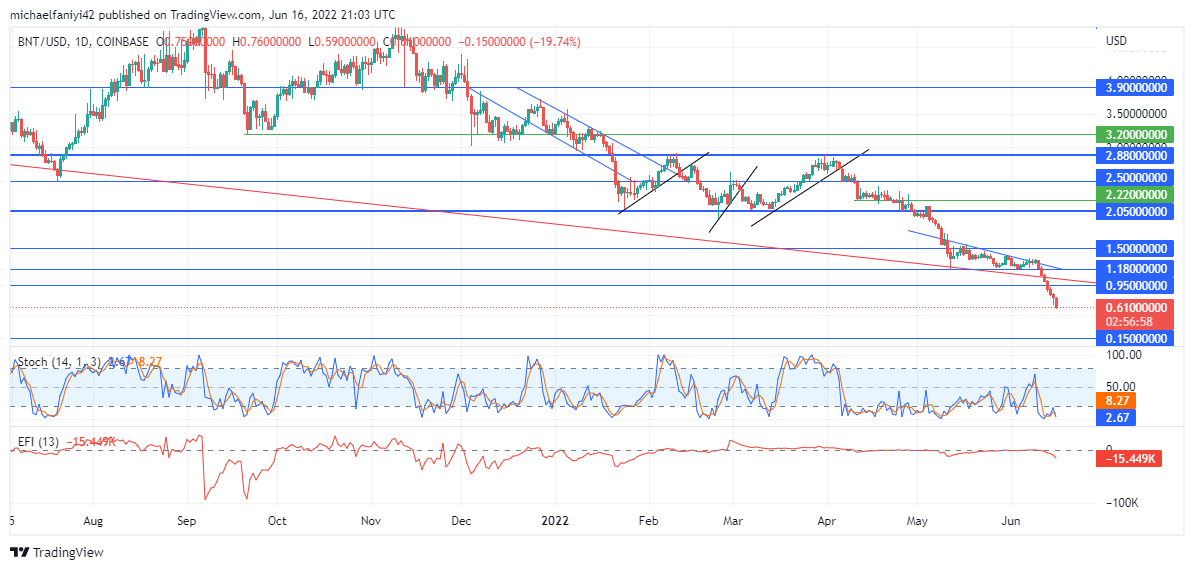
Bancor breaks downward as anticipated from its triangle pattern. A great deal of tussling happens above the $1.180 critical level. When the price touches down at this level on the 12th of May, the coin attempts to spring back upwards, but it is too weak to violate its new resistance at $1.500. Though the buyers aren’t giving up outrightly, their force keeps weakening, and the market is pressured downward against the support until it drops through it.
Bancor Important Zones
Resistance Levels: $2.050, $2.880, $3.900
Support Levels: $0.150, $0.950, $1.180
The market’s downward spiral is something that commenced in 2021 though it wasn’t very obvious initially. But as the market enters the year 2022, the bears’ activities have become even more pronounced. Market investors’ efforts to lift buyers’ moods have been met with a strong opposing force. Therefore, the price has been breaking downward through key levels continually.
The latest activity in the market sees the price beaten below the $1.180 critical level through a descending triangle. The market has plummeted past the next support at $0.950 and is now approaching $0.15. The indicators reveal the general situation in the market. Since early April, the EFI (Elders Force Index) has failed to ascend above the zero level. The Stochastic also falls back onto the oversold region every time it tries to rise.
Market Expectations
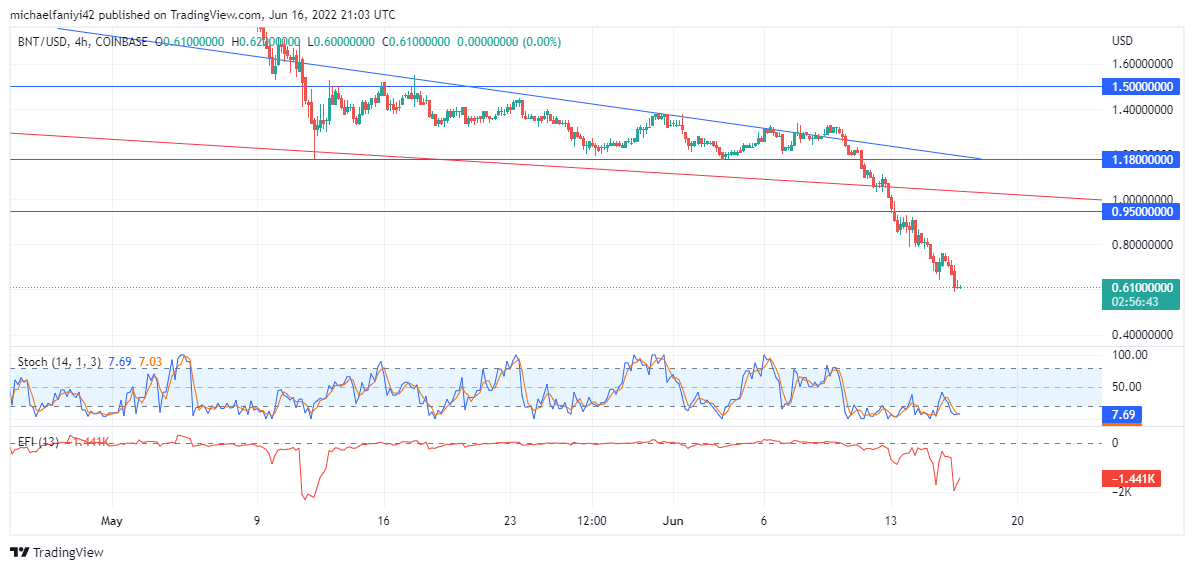
The 4-hour chart is showing that bulls are trying to resist the price. However, their momentum is high, and they keep plunging into the market. The market is now headed for the $0.150 support level. Both the Stochastic and the EFI indicators are showing the bearish strength of the market.
How To Buy Lucky Block
Note: Cryptosignals.org is not a financial advisor. Do your research before investing your funds in any financial asset or presented product or event. We are not responsible for your investing results.