Binance Coin Stabilizes Above $300 Despite Continuing to Fall
Estimated Reading Time: 2 minutes
Don’t invest unless you’re prepared to lose all the money you invest. This is a high-risk investment and you are unlikely to be protected if something goes wrong. Take 2 minutes to learn more
Binance Coin (BNB) Long-Term Analysis: Bullish
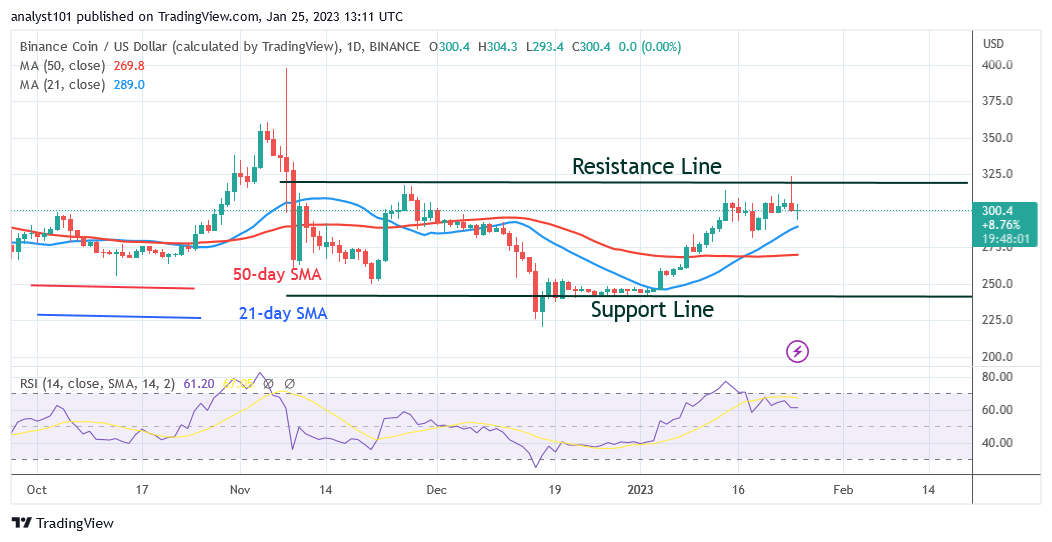
Binance Coin (BNB) price is unchanged as it stabilizes above $300 despite continuing to fall. Before reversing course on January 24, buyers drove the coin to a high of $323. As bulls bought the dips, the cryptocurrency’s price retraced its low of $299.20. BNB is climbing to make a fourth attempt at the resistance at $317.The overbought area of the market is where prices have historically been. Because the asset is overbought, BNB has been unable to hold above the resistance level. If the resistance level is broken, BNB will move upward and retest the overhead resistance level at $359. The market will decline on the downside, and BNB will return to its previous low of $249.
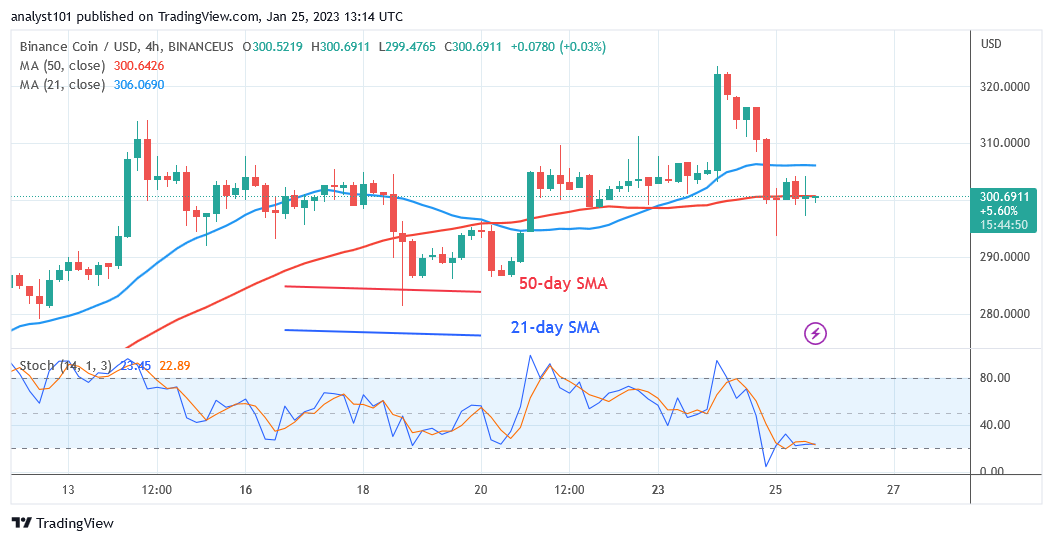
Binance Coin (BNB) Indicator Analysis
For period 14, BNB is at level 61 of the Relative Strength Index. The value of the cryptocurrency asset is increasing to reach earlier highs. The price bars are higher than the moving average lines, indicating that the coin will continue to move higher. Below the daily Stochastic’s level 30, there is a bearish momentum for the cryptocurrency.
Technical indicators:
Major Resistance Levels – $440, $460, $480
Major Support Levels – $240, $220, $200
What Is the Next Direction for Binance Coin (BNB)?
BNB is moving bearishly but stabilizes above $300 despite continuing to fall. The altcoin is now above the 50-day line SMA but has fallen below the 21-day line SMA. The bears initially break below the moving average lines, but they quickly climbed back above the 50-day SMA. The price of BNB is situated in a range, as indicated by the moving average lines.
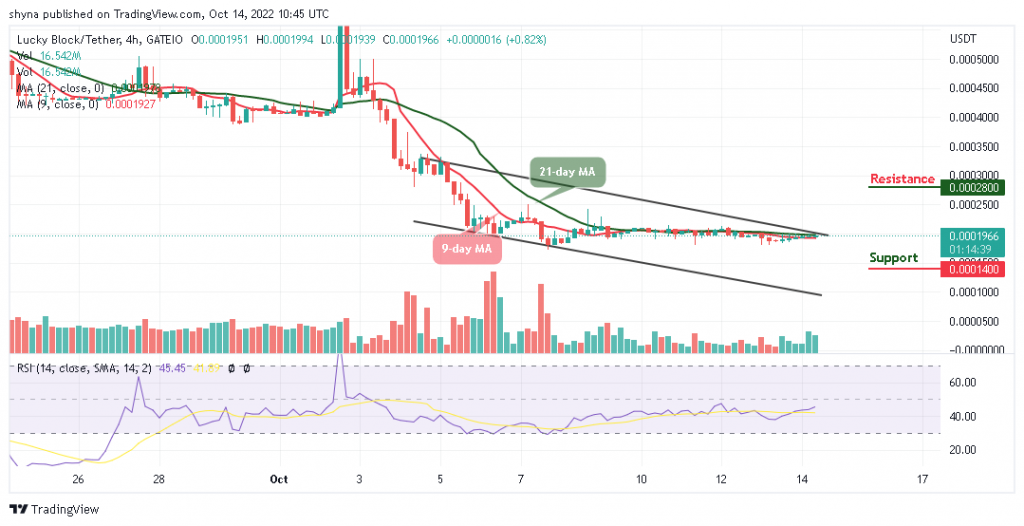
You can purchase crypto coins here. Buy LBLOCK
Note: Cryptosignals.org is not a financial advisor. Do your research before investing your funds in any financial asset or presented product or event. We are not responsible for your investing results