$SPONGE (SPONGE/USD) Soars After Bullish Intervention at $0.00005
Estimated Reading Time: 3 minutes
Don’t invest unless you’re prepared to lose all the money you invest. This is a high-risk investment and you are unlikely to be protected if something goes wrong. Take 2 minutes to learn more

In our prior analysis of the $SPONGE market, it was observed that despite considerable selling pressure, the bullish sentiment persevered, maintaining the price in proximity to the $0.00005 threshold. Additionally, there was notable testing of lower price levels, suggesting the presence of bullish activity beneath the $0.00005 mark. Should the market breach this bullish threshold, it has the potential to catalyze a significant upward price movement.
Key Market Dynamics:
- Resistance Levels: $0.0010, $0.0011, and $0.0012.
- Support Levels: $0.000035, $0.000030, and $0.000025.
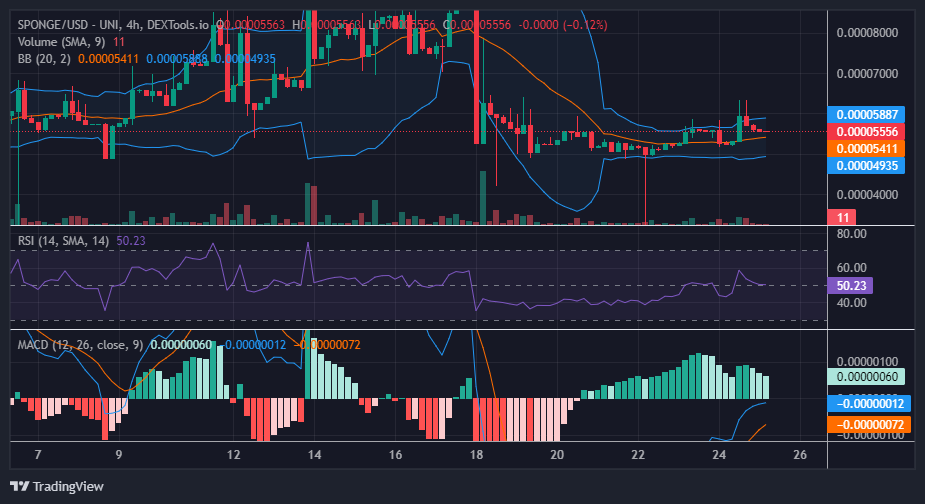
Delving into Technical Analysis for $SPONGE (SPONGE/USD):
The $SPONGE market tested price levels lower than $0.00005 on March 22, aligning with the forecast outlined in the previous analysis and subsequently tipping the market in favor of bullish sentiment. Taking advantage of the reduced prices, bullish traders made significant purchases, resulting in a notable surge in price above the $0.00006 mark.
As the bullish market peaked beyond $0.00006, a shift occurred in favor of the bears; however, bulls seem to have established a higher support level at $0.000055.
Despite the lack of significant changes in the market direction reflected by the Bollinger Bands concerning bullish activity, this can be attributed to the inability to sustain the bullish trend above $0.00006. Currently, with the market stabilizing around $0.000055, it has returned to an equilibrium level.
Nevertheless, a slight upward shift was observed in the upper standard deviation curve of the Bollinger bands. If bulls manage to maintain their position at $0.000055, it would provide further confirmation of a subtle shift in favor of bullish sentiment.
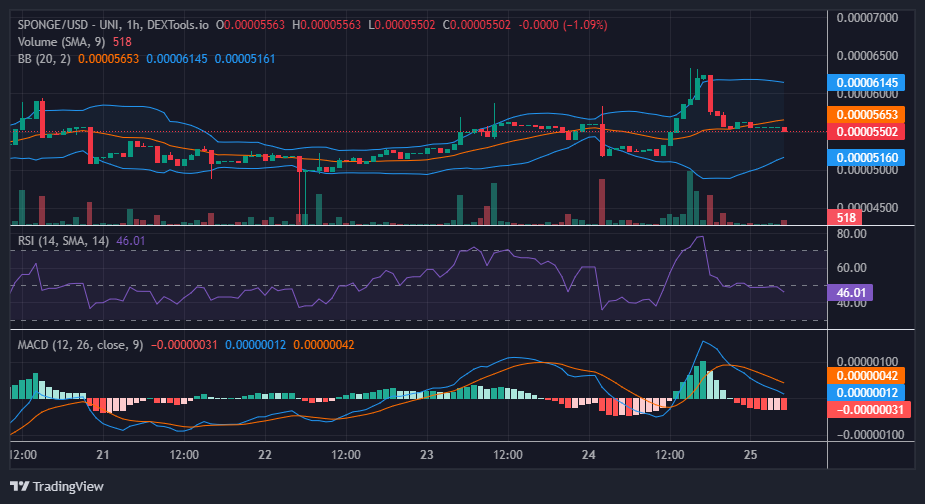
Insights from the 1-Hour Perspective:
Upon analyzing the 1-hour chart of the $SPONGE market, it was observed that the price remained relatively stagnant around the $0.000055 mark for approximately four sessions before a minor bearish shift was noted towards this threshold. It is plausible that reaching this threshold could incite another bullish price movement. Considering this crypto signal, traders are advised to remain vigilant in anticipation of this anticipated bullish trend.
With V2, $SPONGE is BACK—bigger, better, and prepared to take in moisture!
🚀Missed 100x in 2023?💥 $SPONGE is BACK with V2 – Bigger, Better, and ready to absorb the damp!
Hurry and stake now to join the ride! 🔥#SpongeV2 #Web3 #Crypto #Alts pic.twitter.com/VMooQjC79H
— $SPONGE (@spongeoneth) March 25, 2024
Invest in the hottest and best meme coin. Buy Sponge ($SPONGE) today!