Polygon (ex-MATIC) Price Prediction: POL/USDT Consolidates After Hitting Limits
Estimated Reading Time: 2 minutes
Don’t invest unless you’re prepared to lose all the money you invest. This is a high-risk investment and you are unlikely to be protected if something goes wrong. Take 2 minutes to learn more

Polygon (ex-MATIC) Price Prediction: May 3, 2025
The Polygon (ex-MATIC) market has recently breached the resistance at the $0.2000 price level and has since been trading above this region. However, indications are suggesting that the market may be facing resistance at its current level. Let’s examine this market more closely.
POL/USDT Long-Term Trend: Bullish (Daily Chart)
Key Price Levels:
Resistance: $0.2500, $0.3000, $0.3500
Support: $0.2000, $0.1500, $0.1000
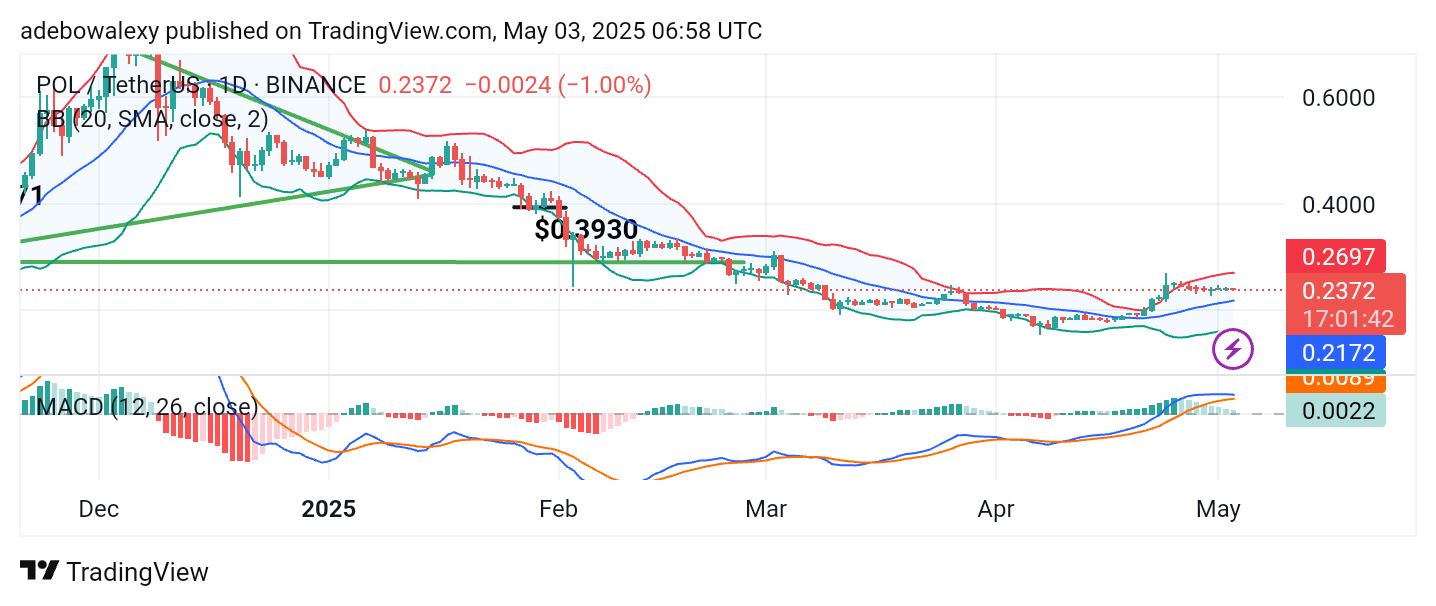
Price activity on the Polygon (ex-MATIC) daily chart has shown minimal movement in either direction. The latest price candle is red but reflects only minor activity once again. However, trading remains above the midline of the Bollinger Bands. Similarly, the Moving Average Convergence Divergence (MACD) lines are moving sideways above the equilibrium level. The pale green bars on the MACD histogram indicate weak momentum in the market.
Polygon (ex-MATIC) Price Prediction: POL/USDT Is Well Positioned but Lacks Momentum
Price action in the Polygon (ex-MATIC) market remains above key technical levels, despite lacking significant movement. Over the past week, candles have appeared in an almost dashed or compressed form, especially after attempting to break the upper limit of the Bollinger Bands.
Currently, trading activity remains just above the midline of the Bollinger Bands. The MACD lines are trending sideways, indicating market indecision. The histogram bars remain faint, signaling only mild momentum.
Polygon (ex-MATIC) Price Prediction: POL/USDT May Be Coiling Up for a Breakout
The Polygon (ex-MATIC) market appears to be contracting, with the Bollinger Bands tightening significantly. Price candles are clustered around the middle band, showing a lack of strong directional bias.
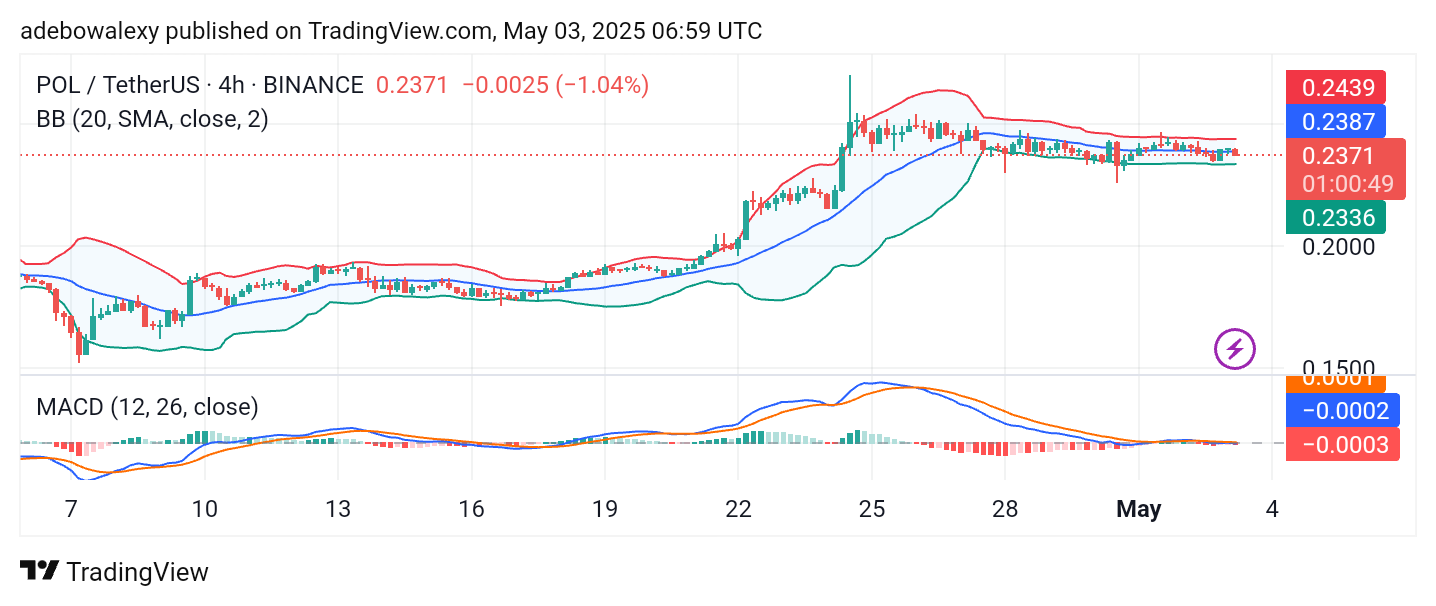
Likewise, the MACD lines are moving sideways near the equilibrium level, and the histogram bars are very small—almost invisible—signaling extremely low momentum. However, the narrowing of the Bollinger Bands suggests that a strong breakout may be imminent. Traders can target the $0.2500 level for potential short-term gains.