BNB (BNB/USDT) Seeks Correction After Rejection at $736.13
Estimated Reading Time: 3 minutes
Don’t invest unless you’re prepared to lose all the money you invest. This is a high-risk investment and you are unlikely to be protected if something goes wrong. Take 2 minutes to learn more
BNB Long-term Analysis: Bullish
Over the past weeks, BNB against the Tether has experienced a significant rally, breaking through several resistances. However, the recent formation of bearish candlesticks at the top of the trend with the indicators’ overbought conditions suggests a possible pullback is near.
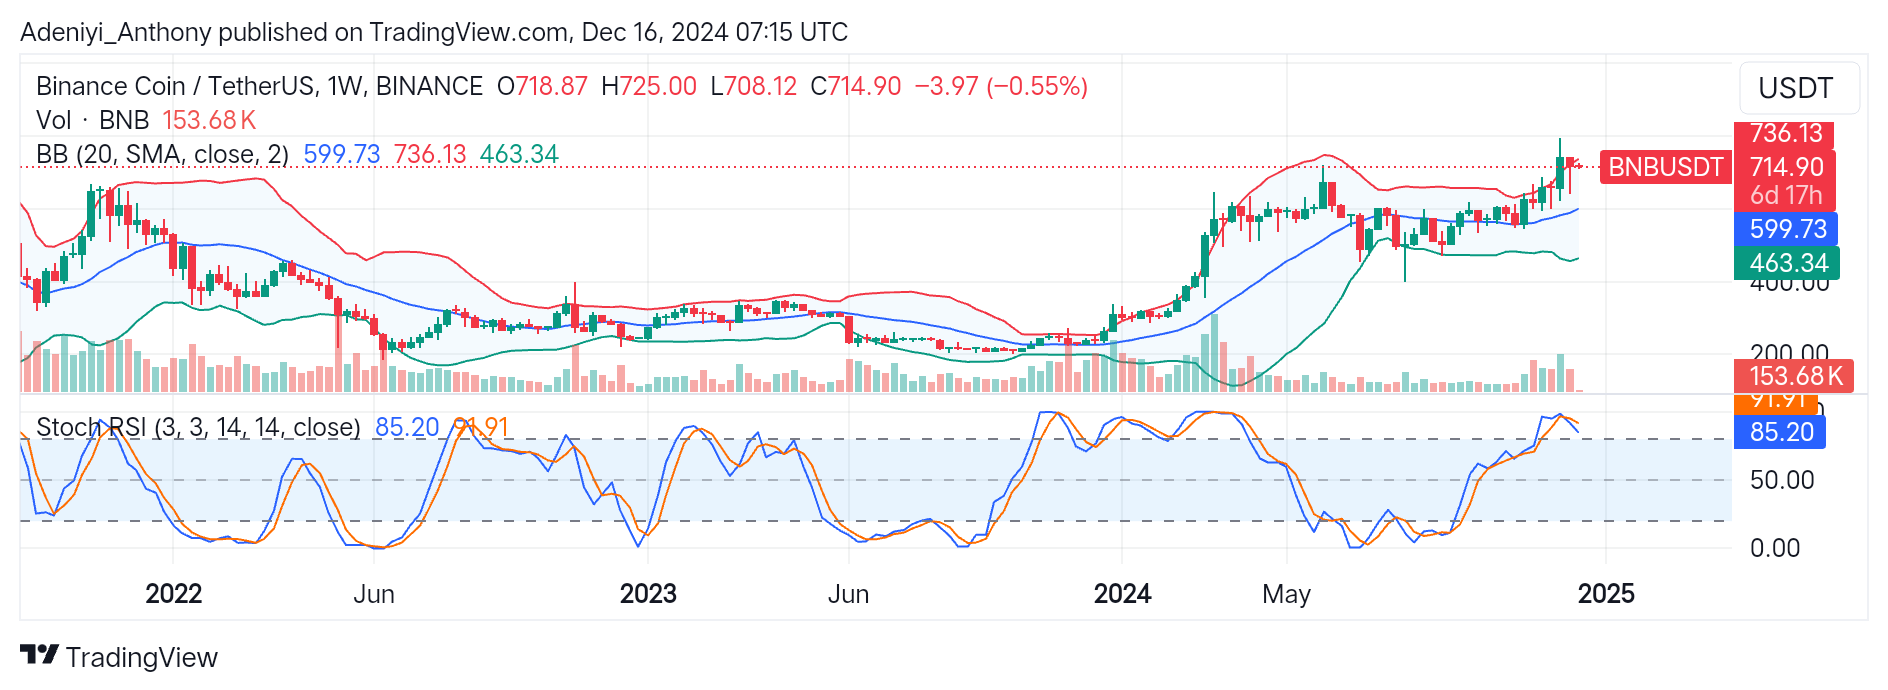
Recently, BNB/USDT has been hovering around the upper band with several wicks shooting above $736.13. This captures the struggles between the bears and the bulls. However, the price seems to be making a downturn as the pair goes down by 0.55%, with the $736.13 level acting as a strong resistance. At this point, traders may have to be cautious as the price may retrace to test previous supports.
Currently, BNB is trading at $714.90 with 153.68 thousand weekly traded volumes.
Technical Indicators
Major Resistance Levels: $736.13, $750, $800
Major Support Levels: $600, $463.34, and $400
BNB Technical Analysis
The analysis of BNB against the Tether on a weekly timeframe shows that the pair is acting under some selling pressure after the formation of bearish candles near the $736 level and a declining trading volume. This price action suggests a potential pullback in the near term towards $600 after hitting the upper band.
With the declining volume, the Stochastic RSI reads extreme values of 91.91 and 85.20, with the blue line leading the way to the South. This suggests weakening bullish momentum, reinforcing the potential for a pullback. However, a significant spike in volume may also confirm bearish strength, as indicators in this timeframe signal a correction is on the horizon.
BNB Analysis: What to Expect
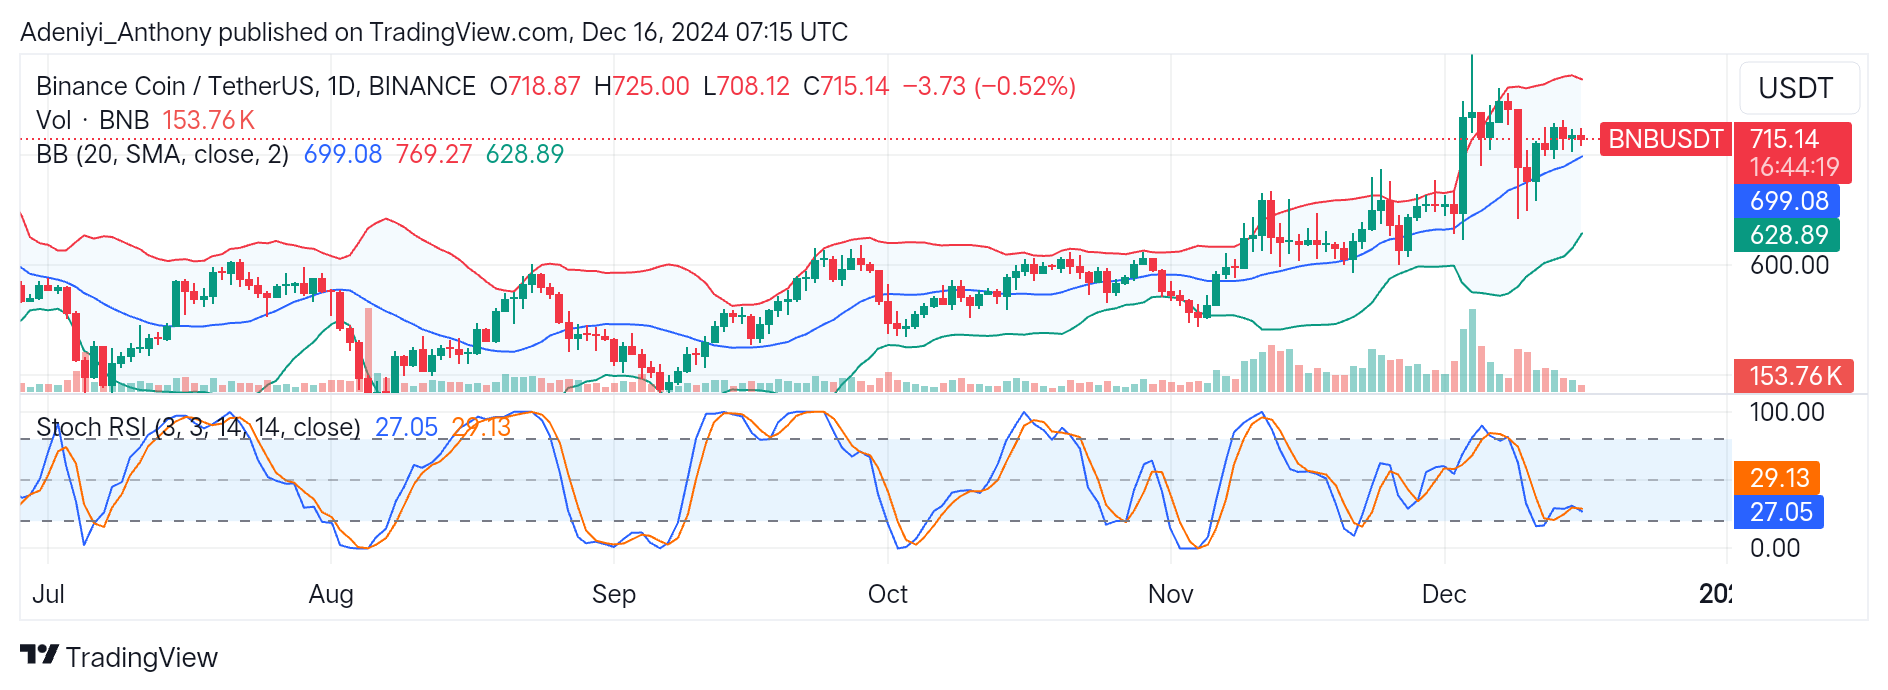
The analysis of BNB/USDT on a daily timeframe shows that traded volumes have been on the decline since the recent bullish surge, suggesting reduced buying interest. However, recent price actions above the mid-Bollinger band at $699.18 suggest the pair lacks direction, and a break below the mid-line would accelerate the pullback to the $600 level.
Also, the stochastic oscillator, which shows momentum, indicates a bearish crossover as the lines further deepen into the oversold zone. Therefore, a decisive break below the 20-mark level on the oscillator would give room for more bearish pressure.
You can purchase crypto coins here. Buy LBlock