BNB (BNB/USDT) Faces Rejection at $742.50, Seeks Support Near $700 Level
Estimated Reading Time: 3 minutes
Don’t invest unless you’re prepared to lose all the money you invest. This is a high-risk investment and you are unlikely to be protected if something goes wrong. Take 2 minutes to learn more
BNB Long-term Analysis: Bullish
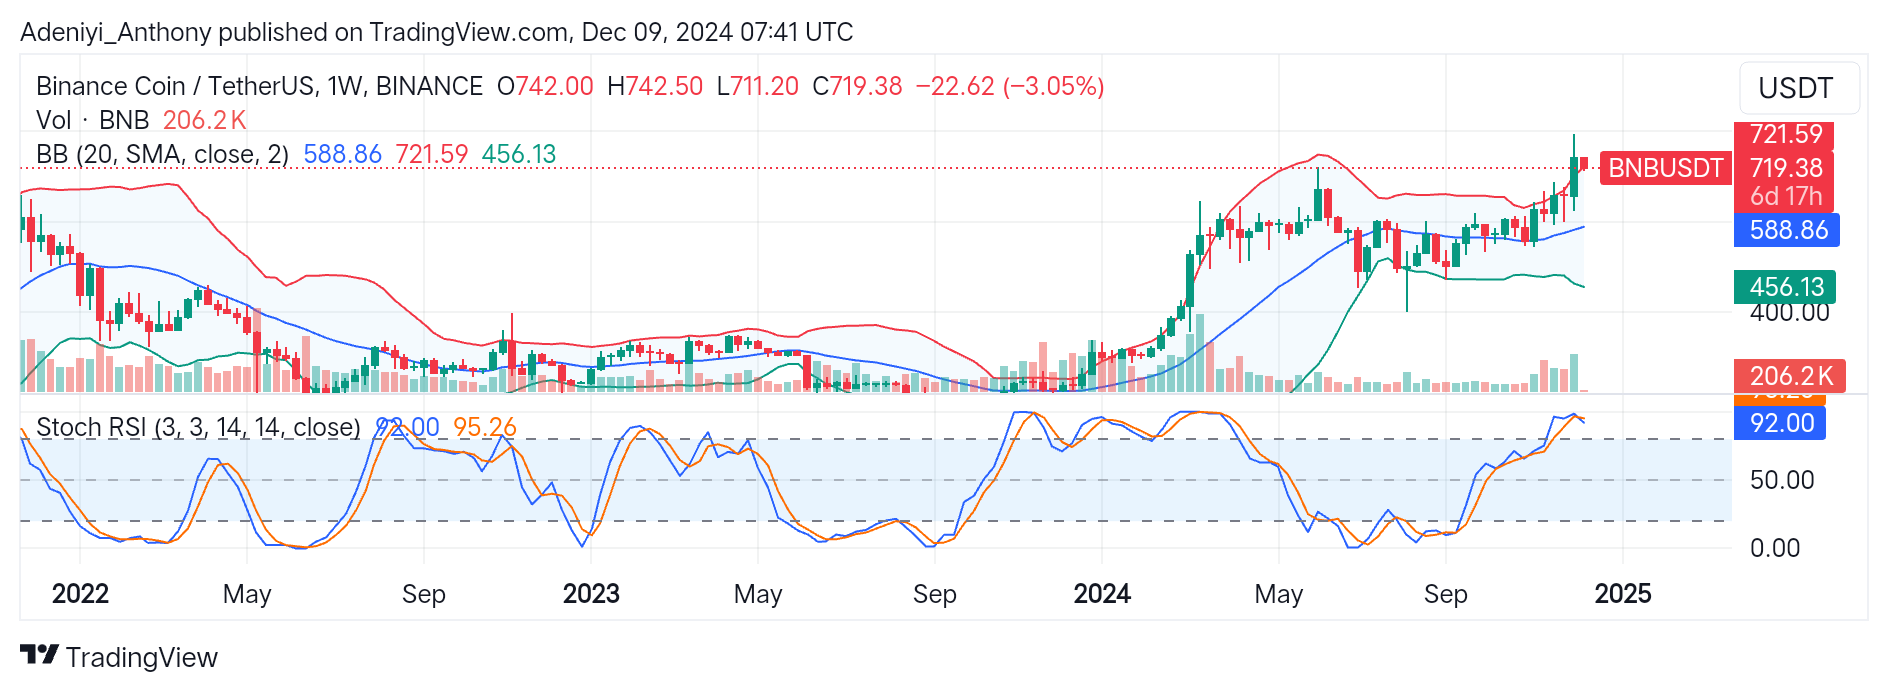
The price of BNB has been progressively rising since the beginning of 2024, breaking through important resistance levels along the way. To this end, the overall market sentiment against Tether on a weekly basis indicates that the pair is in a bullish trend. However, the recent development of a bearish candle implies that the pair may be having problems trading near the upper range at $721.59.
BNB recently peaked at $742.50 before retreating to its present position, with the Stochastic RSI predicting additional correction.
Currently, BNB trades at $719.38 with a significantly low weekly market participation of 206.2k traded volume.
Technical Indicators
Major Resistance Levels: $721.59, $742.50, and $800
Major Support Levels: $700, $588.86, and $456.13
BNB Technical Analysis
The analysis of BNB against the Tether on a weekly timeframe shows that the pair’s bullish momentum has been halted as the price seems to be facing correction after hitting a strong resistance at the $721.59 level. The price movement around the upper band is consistent with the classic overbought signal. This implies a retracement to the $700 level above the mid-band may occur if purchasing pressure eases.
Furthermore, a Stochastic RSI reading above 92 signals the possibility of a short-term decline because the pair is in the overbought zone. As a result, a downward crossover of the lines would signal a temporary pause in the uptrend.
BNB/USDT Analysis: What’s Next?
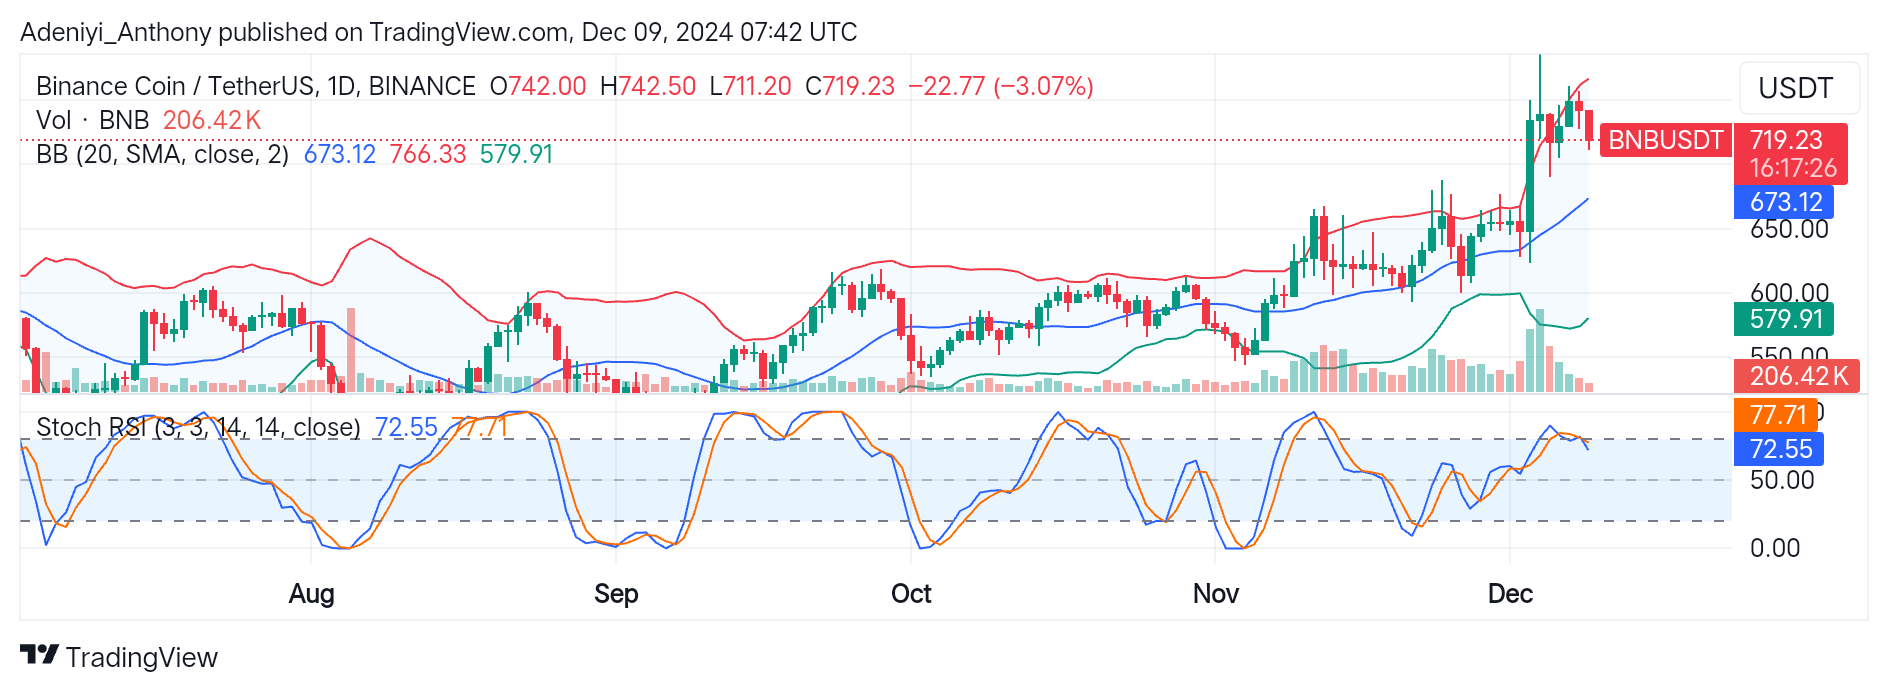
The daily timeframe analysis of BNB/USDT reveals that the pair has shown strong bullish momentum in recent weeks, breaking above the upper band. However, this gain was short-lived, as bulls appear to have lost market dominance after reaching $742.50.
The divergence of the bands denotes increasing volatility, although the Stochastic oscillator indicates the pair is in a neutral state. However, if volume and momentum grow, the $673.12 level may be a re-entry point for bulls. On the contrary, with the Stochastic lines going south, a bearish crossover would indicate additional downside danger beyond the mid-line at $579.91.
Therefore, traders are advised to focus on volume patterns and price reactions at the $673 support level.
You can purchase crypto coins here. Buy LBlock