BNB (BNB/USDT) Hints at a Potential Pullback
Estimated Reading Time: 3 minutes
Don’t invest unless you’re prepared to lose all the money you invest. This is a high-risk investment and you are unlikely to be protected if something goes wrong. Take 2 minutes to learn more
BNB Long-term Analysis: Ranging
In recent times, BNB against the Tether has experienced volatile trading behavior. The price movement of the pair appears to be consolidating in close range after a bullish momentum.
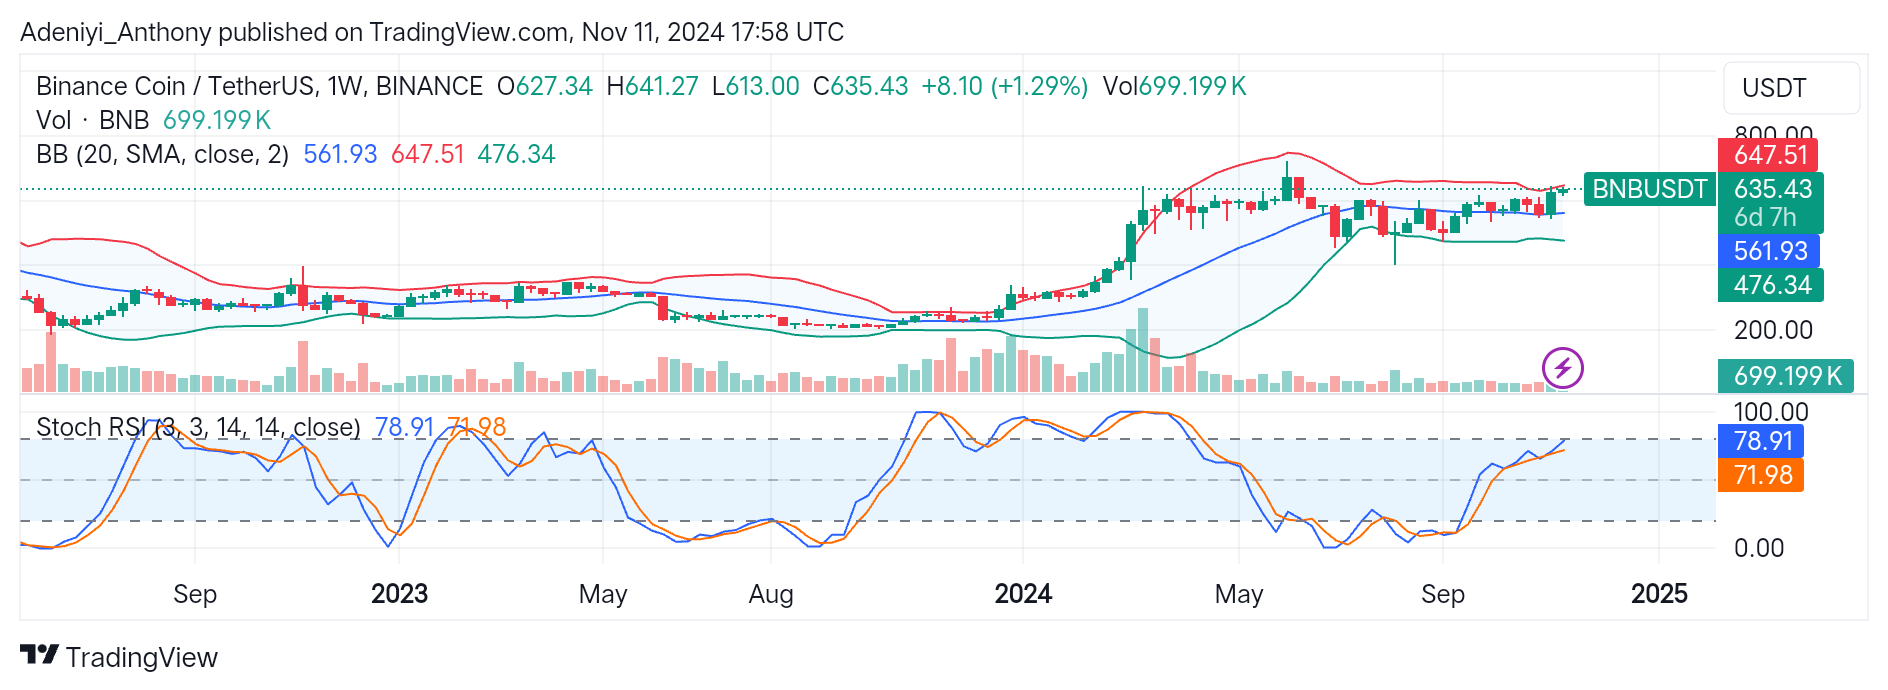
Currently, the market sentiment presents a cautious outlook, with BNB pushing higher despite the near-overbought condition of the Stochastic oscillator. However, traders must watch the $647 and $561 levels to gauge potential breakouts from either side, as the Bollinger indicates potential upcoming price swings.
Currently, BNB is trading at $635.43 with a slight increase in trading volume and a positive change in the trading session. This suggests the presence of bullish traders in the market.
Technical Indicator
Major Resistance Levels: $647.51, $680, and $700
Major Support Levels: $561.93, $500, and $476.34
BNB Technical Analysis
BNB on a weekly timeframe appears to be ranging around a critical level. However, the recent price movement suggests there might be a pullback or correction in the near term.
On the chart, the Bollinger bands show potential for increased bullish momentum as the price appears to be testing the upper band. To this end, if the price breaks above the current resistance with increased volume, it may lead to a breakout towards $680; otherwise, an increased selling pressure around this level may push the price towards the mid-band at $561.
On the other hand, the Stochastic RSI suggests the pair is approaching the overbought region. This setup indicates there might be a possible pullback once there is a crossover of the lines of the indicator. However, with the relatively increasing volume, traders should watch out for the $647 and $561 levels to confirm the pair’s next move.
BNB/USDT Analysis: What to Expect
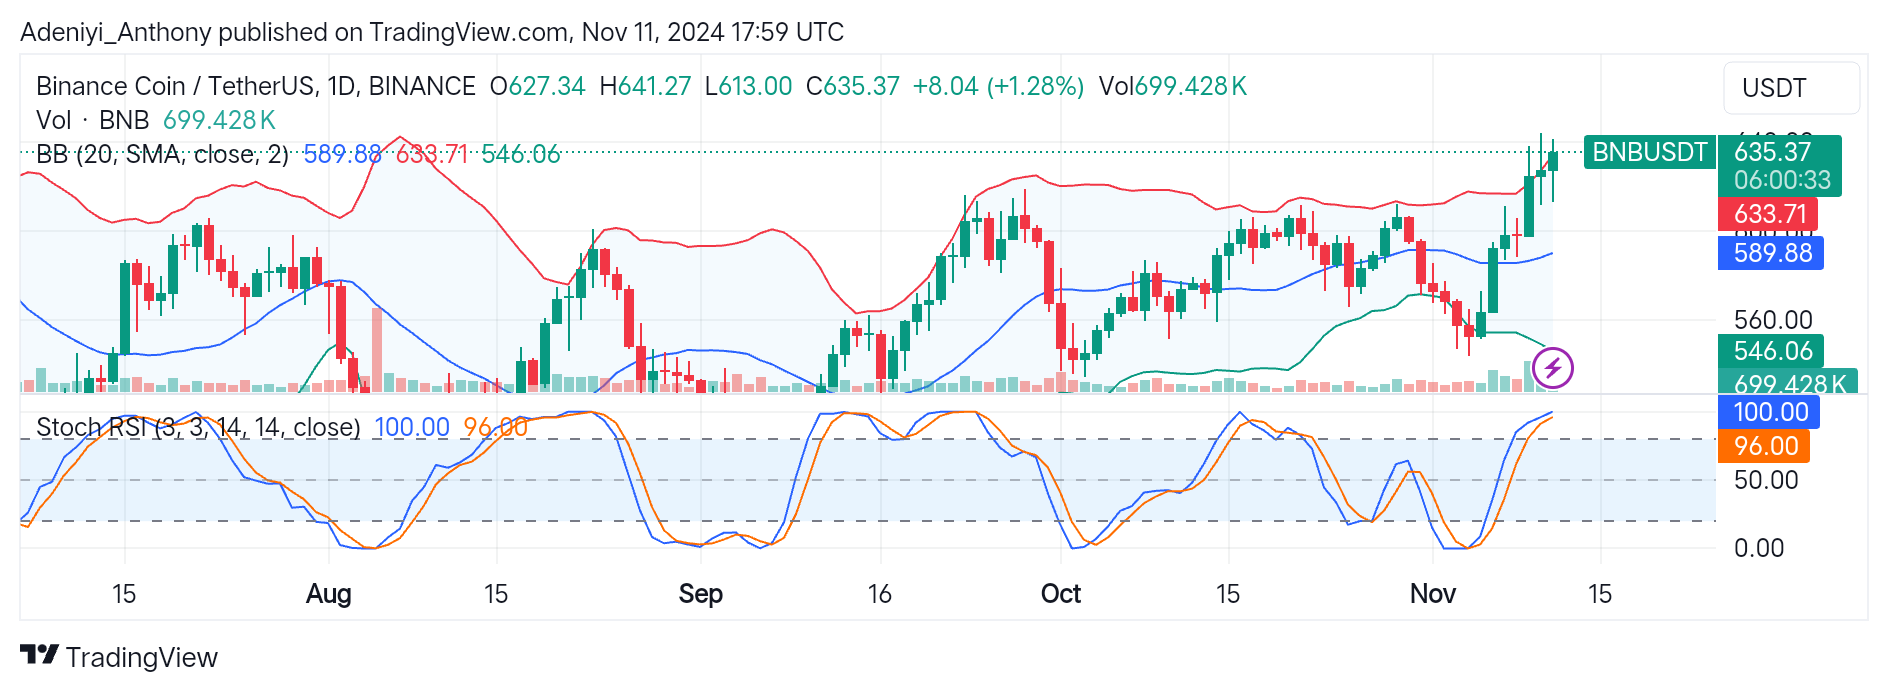
BNB/USDT appears to be trading above the upper band; though bullish, the Bollinger band suggests an overextended upside run. Moreover, the recent formation of the bullish candlestick suggests an overbought condition, and the pair may face minor selling pressure soon.
On the other hand, the Stochastic RSI suggests the pair is currently overbought with the lines of the indicator operating in the 90 level. This signals a weakened buying pressure, and the pair may experience a pullback soon before any uptrend.
Therefore, with a spike in volume and extended overbought condition, the pair may experience a minor dip in price. However, this could be advantageous as it will create room for more uptrends with the required bullish strength.
You can purchase crypto coins here. Buy LBlock