Price Prediction: LBLOCK/USD Trading Above $0.000160 Level
Estimated Reading Time: 3 minutes
Don’t invest unless you’re prepared to lose all the money you invest. This is a high-risk investment and you are unlikely to be protected if something goes wrong. Take 2 minutes to learn more
Lucky Block Price Prediction – October 19
The Lucky Block price prediction breaks above the resistance level of $0.00020, aiming to cross above the moving averages.
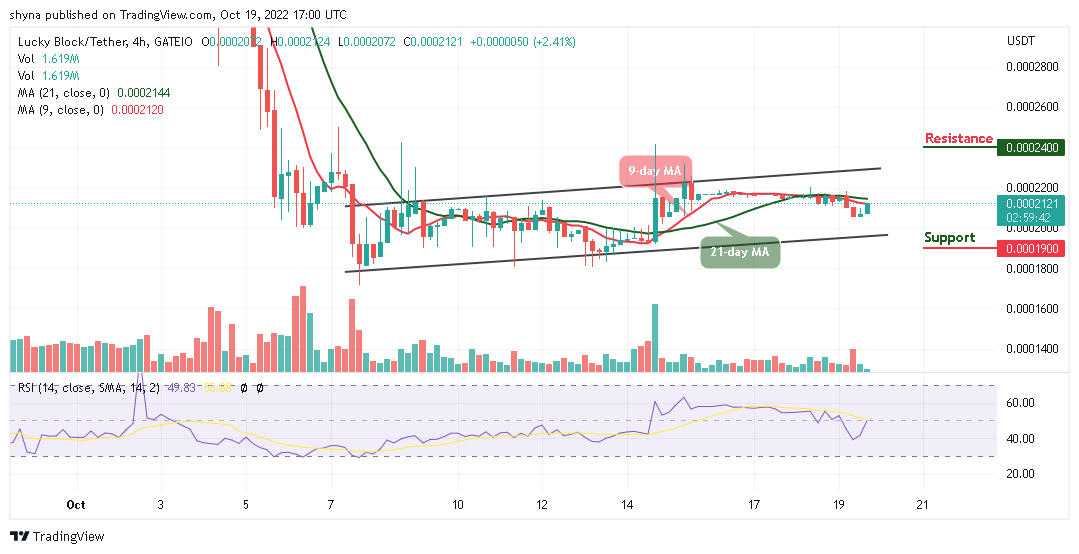
LBLOCK/USD Medium-term Trend: Ranging (4H Chart)
Key Levels:
Resistance levels: $0.00024, $0.00025, $0.00026
Support levels: $0.00019, $0.00018, $0.00017
LBLOCK/USD is preparing for a move higher as the coin crosses above the resistance level of $0.00020. The bullish candlestick within the channel portrays a market with the buyer in full control of the session. The Lucky Block price is now ready for another upward price performance as buying pressure and selling pressure are getting even.
Lucky Block Price Prediction: LBLOCK/USD Trades Bullishly
When the chart begins to display candles like this, it is usually a sign that a bullish movement is coming to play. To confirm this, traders can see that the bullish trends continue in today’s trading session. However, traders can also see that the volatility of the Lucky Block price is increasing slightly as sellers are trying to come back into the market. Meanwhile, any bearish movement towards the lower boundary of the channel could hit the supports at $0.00019, $0.00018, and $0.00017.
Looking at the 4-hour chart, the Relative Strength Index (14) technical indicator is moving around above the 50-level, should the buyers push the market price above the 9-day and 21-day moving averages, the bulls can look forward to the potential resistance levels above the upper boundary of the channel at $0.00024, $0.00025, and $0.00026.
LBLOCK/USD Medium-term Trend: Ranging (2H Chart)
On the 4-hour chart, the Lucky Block (LBLOCK) is moving below the 9-day and 21-day moving averages as the buyers are gaining momentum within the market, this could push the coin to cross above the 9-day and 21-day moving averages.
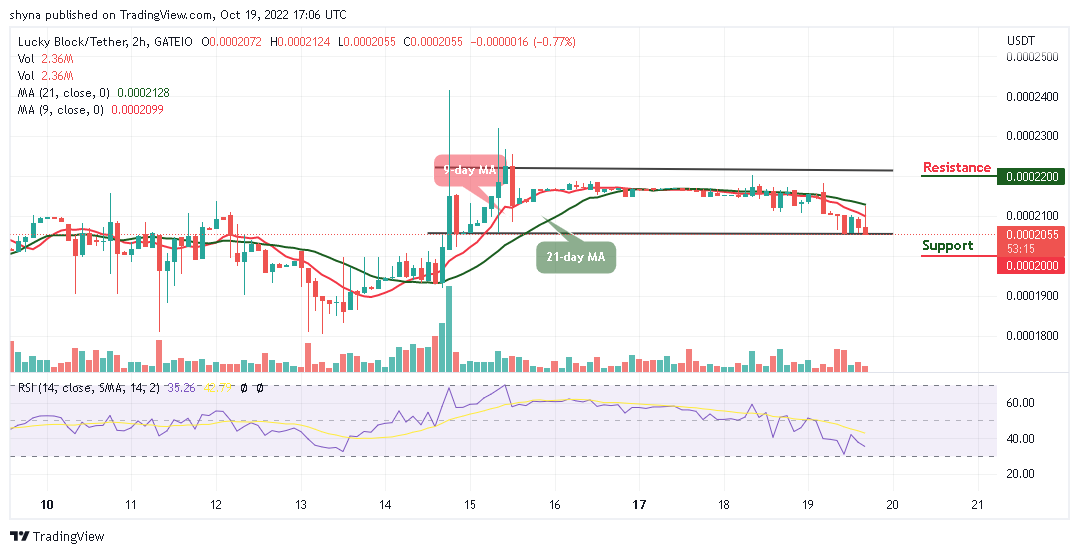
Looking at the chart, the buyers will rebound to push the coin toward the upper boundary of the channel, once this is done, the coin will hit the resistance level at $0.00022 and above. However, any further bearish movement below the lower boundary of the channel could hit the support at $0.00020 and below as the technical indicator Relative Strength Index (14) remains below the 40-level.
You can purchase Lucky Block here. Buy LBLOCK

