Lucky Block Price Prediction: LBLOCK/USD Prepares to Break $0.00020 Level
Estimated Reading Time: 2 minutes
Don’t invest unless you’re prepared to lose all the money you invest. This is a high-risk investment and you are unlikely to be protected if something goes wrong. Take 2 minutes to learn more

Free Crypto Signals Channel
The Lucky Block price prediction reveals that as soon as the bulls begin to increase their momentum, the price will go up.
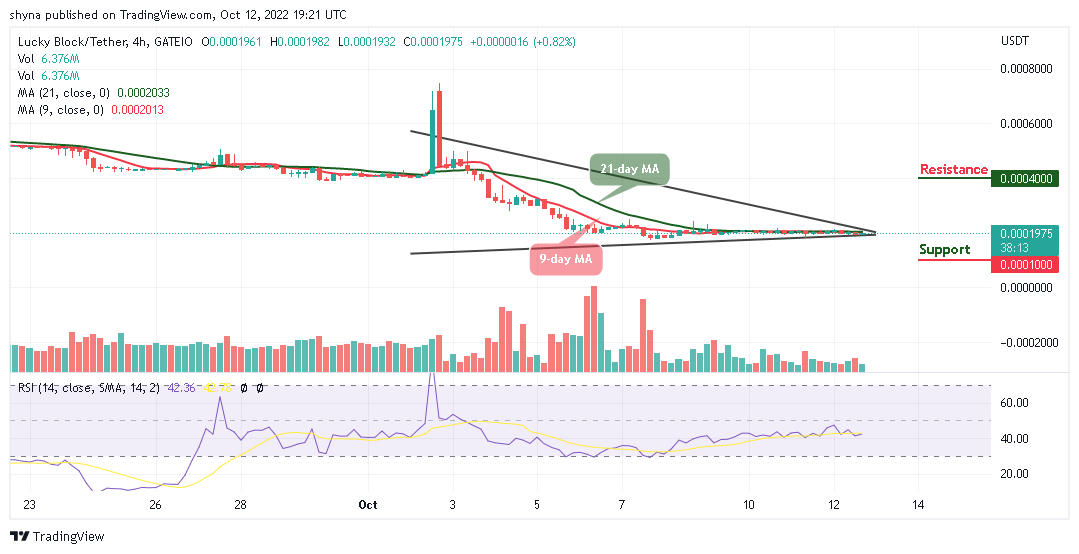
LBLOCK/USD Medium-term Trend: Ranging (4H Chart)
Key Levels:
Resistance levels: $0.00040, $0.0042, $0.00044
Support levels: $0.00010, $0.00008, $0.00006
LBLOCK/USD is moving sideways as the coin trades above the 9-day and 21-day moving averages. Meanwhile, the bullish momentum is coming to play in the market soon and the bullish pressure could break the $0.00020 level. However, if the bulls fail to drive the price higher, the Lucky Block price could consolidate for some time.
Lucky Block Price Prediction: LBLOCK/USD will face the Upside
The Lucky Block price is changing hands at $0.000197 where it will make a cross above the upper boundary of the channel. However, as soon as the coin begins the journey to the north, it will locate the potential resistance levels at $0.00040, $0.00042, and $0.00044 while the support levels could be found at $0.00010, $0.00008, and $0.00006 for the new entries as the technical indicator Relative Strength Index (14) moves above 40-level.
LBLOCK/USD Medium-term Trend: Ranging (1H Chart)
The Lucky Block price keeps fluctuating below the 9-day and 21-day moving averages. The technical indicator Relative Strength Index (14) is above the 40-level as the coin prepares for upward movement. However, any bullish movement above the 21-day moving average could reach the resistance level at $0.00021 and above.
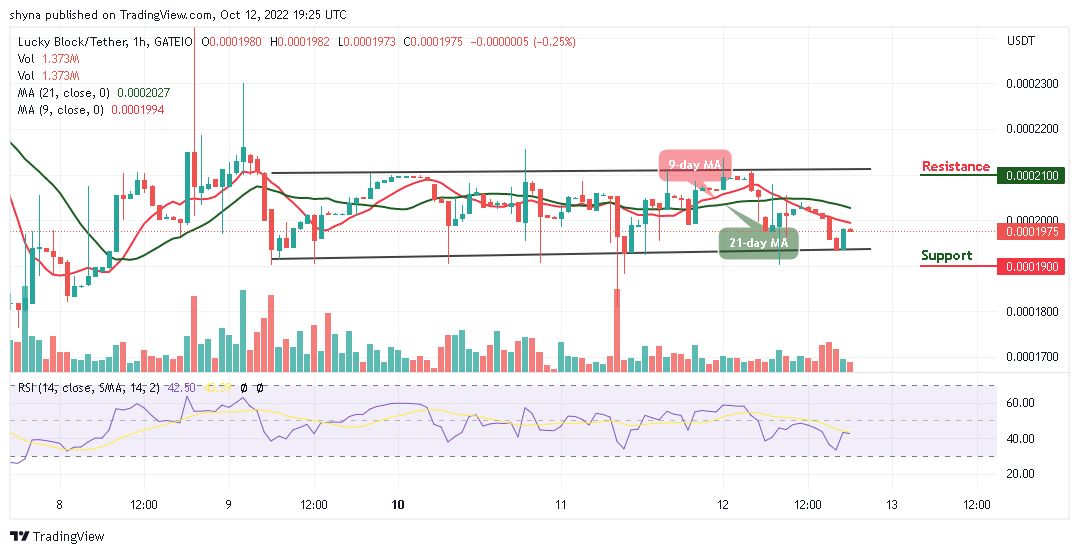
In addition, LBLOCK/USD will begin to display some bullish signals immediately after the sideways movement, and once this happens, the market price will head to the upside, but if the price drops and cross below the lower boundary of the channel, it could touch the nearest support at $0.0019 and below.
You can purchase Lucky Block here. Buy LBLOCK