Bitcoin (BTC/USD) Trade Rallies Close to $40,000
Estimated Reading Time: 3 minutes
Don’t invest unless you’re prepared to lose all the money you invest. This is a high-risk investment and you are unlikely to be protected if something goes wrong. Take 2 minutes to learn more

Free Crypto Signals Channel
Bitcoin Price Prediction – February 2
Over a notable couple of variant sessions, the BTC/USD market has been sequentially trying to push northwardly as the crypto-economic trade now rallies close to $40,000. The worth of the crypto economy is trading between the high and low of $38,901 and $38,423. And the market’s percentage is rated at 0.51 negative.
BTC/USD Market
Key Levels:
Resistance levels: $40,000, $42,500, $45,000
Support levels: $35,000, $32,500, $30,000
BTC/USD – Daily Chart
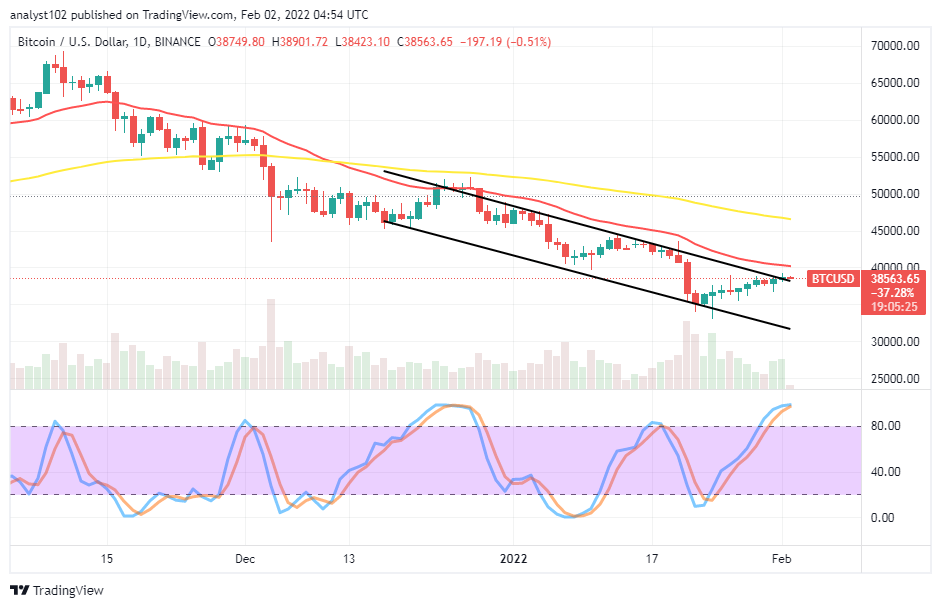
The BTC/USD daily chart showcases the crypto-economic trade rallies close to $40,000 in its heightening efforts. The upper bearish channel trend line drew below the smaller SMA. The 50-day SMA indicator is above the 14-day SMA indicator, with a space separating them apart. The Stochastic Oscillators have deeply penetrated the overbought region with their lines attempting to close within. That signals the possibility of not seeing a reliable upward force from its current trading spot in the subsequent sessions.
Will the BTC/USD market resume free fall-offs as the crypto-economic trade rallies close to $40,000?
Expectantly, the BTC/USD market may in no time resume free fall-offs in its valuation as the crypto-economic trade rallies close to the $40,000 level. However, the rallying pressures appear not complete yet as the resistance value-line mentioned has not been touched. And there may be a pushing attempt to achieve that scenario. But, it may not be too good for buyers to ride on such a situation to avoid unnecessary whipsaw in the near time.
On the downside of the technical analysis, the market short-position traders currently appear to have a brighter chance to re-launch sell orders especially, when the price tends to make a false upswing around the $40,000 resistance trading level. On the long-term downward-trending path, the market has to hit resistance around the value line to get a decent bearish trading situation resuming again.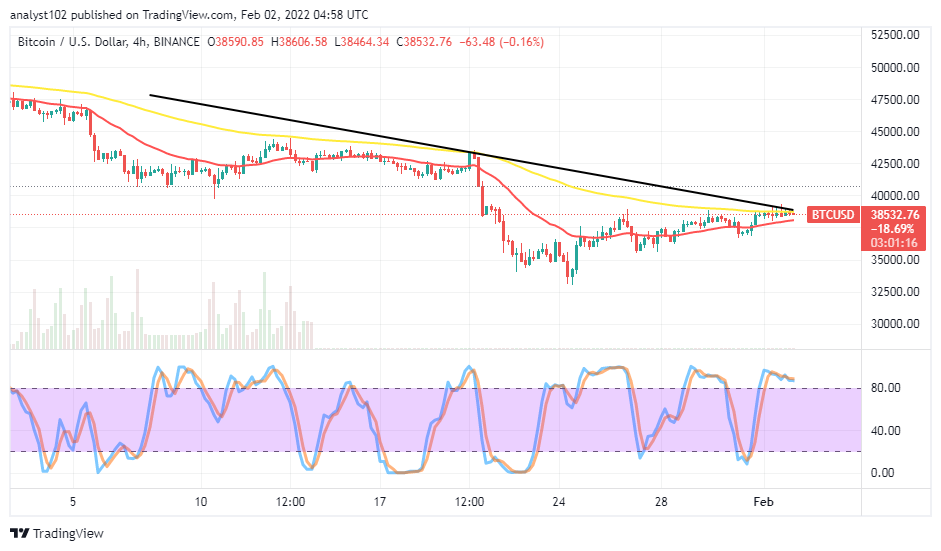
BTC/USD 4-hour Chart
The BTC/USD 4-hour chart reveals the crypto-economic trade rallies close to the $40,000 resistance level. The 14-day SMA indicator is closely underneath the 50-day SMA indicator. The bearish trend line drew above them to indicate that the price is still under falling pressure. The Stochastic Oscillators are in the overbought region with conjoined lines. And a slight consolidation-moving style is ongoing in the market as of writing. That indicates the possibility of witnessing smaller-ups for a while. A sudden bearish candlestick at any point in time at that trading capacity level will portend a sign to getting a reversal of the trading situation afterward.
Note: Cryptosignals.org is not a financial advisor. Do your research before investing your funds in any financial asset or presented product or event. We are not responsible for your investing results.
You can purchase crypto coins here. Buy Tokens