Uniswap (UNI) Price Prediction: BTC/USDT Hits a Strong Resistance at the $12.00 Mark
Estimated Reading Time: 3 minutes
Don’t invest unless you’re prepared to lose all the money you invest. This is a high-risk investment and you are unlikely to be protected if something goes wrong. Take 2 minutes to learn more

Uniswap (UNI) Price Prediction: June 6
Price movement in the Uniswap market has breached the $8.00 and $10.00 resistance levels on the daily price chart. However, as soon as price action hit the $12.00 mark, it faced resistance, leading to a correction off that mark and through the support level at $11.00.
UNI/USDT Long-term Trend: Bullish (Daily Chart)
Key Levels:
Resistance Levels: $12.00, $14.00, and $16.00
Support Levels: $10.00, $8.00, and $6.00
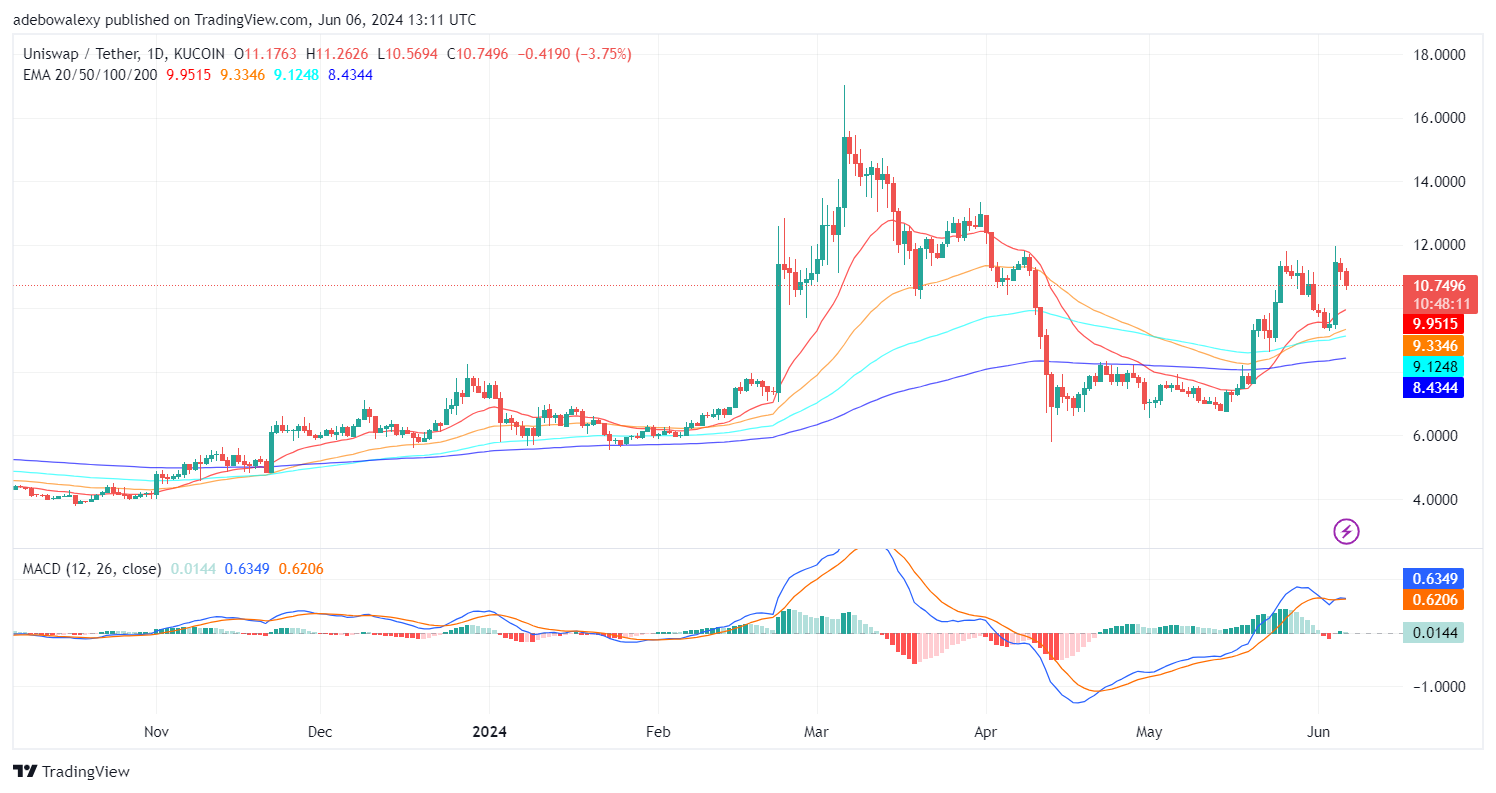
While the observed downward correction has been moderate, the price activity of the token remains above all the Exponential Moving Average (EMA) lines. Trading activity continues above the $10.00 mark, serving as a technical support level. Meanwhile, the Moving Average Convergence Divergence (MACD) indicator lines have risen above the equilibrium level. However, the lines of this indicator appear mangled and do not provide a clear impetus to the market.
Uniswap Price Prediction: Will the Upside Correction in the UNI/USDT Resume?
The resulting downward correction in the Uniswap daily market appears minimal but has spanned two consecutive sessions. The current session, despite having upper and lower shadows, appears to have delivered more downward correction than the previous session.
Be that as it may, it is worth noting that trading activities in this market remain above the EMA lines. The MACD lines stand above the equilibrium level but appear mangled. Nevertheless, this to some extent maintains the hope that upside forces will resume action, taking prices higher.
UNI/USDT Medium-term Trend: Uniswap May Have Found Support at the 20-day EMA (4H Chart)
Price action in the Uniswap 4-hour market has trended gradually downward toward the EMA lines. As price action hit the 20-day EMA line in the previous session, an upside rebound can be seen, resulting in the ongoing session. Meanwhile, the MACD indicator lines have converged above the equilibrium level for a bearish crossover. The bars of this indicator have vanished into the equilibrium level, as the ensuing lines may threaten upside corrections.
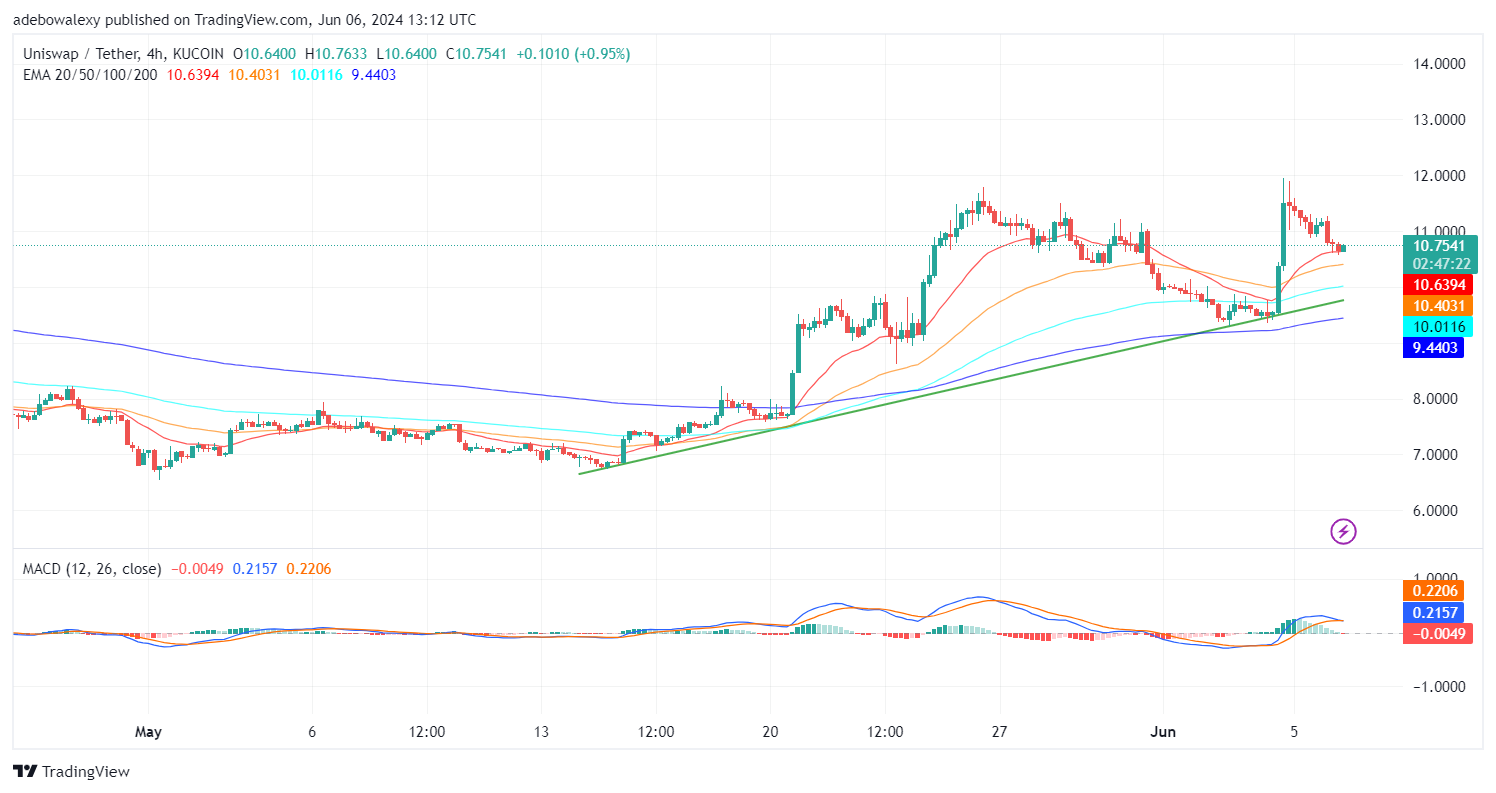
The behavior of price activity after hitting the EMA lines suggests that upside forces in the market may have reached a support level. Additionally, the MACD indicator lines are above the equilibrium level but have a bearish prospect due to the bearish convergence. Meanwhile, this market can be seen trending upward along an upside-sloping trendline. Therefore, it implies that this market may soon cross the $11.00 mark to revisit the $12.00 mark at the very least.